
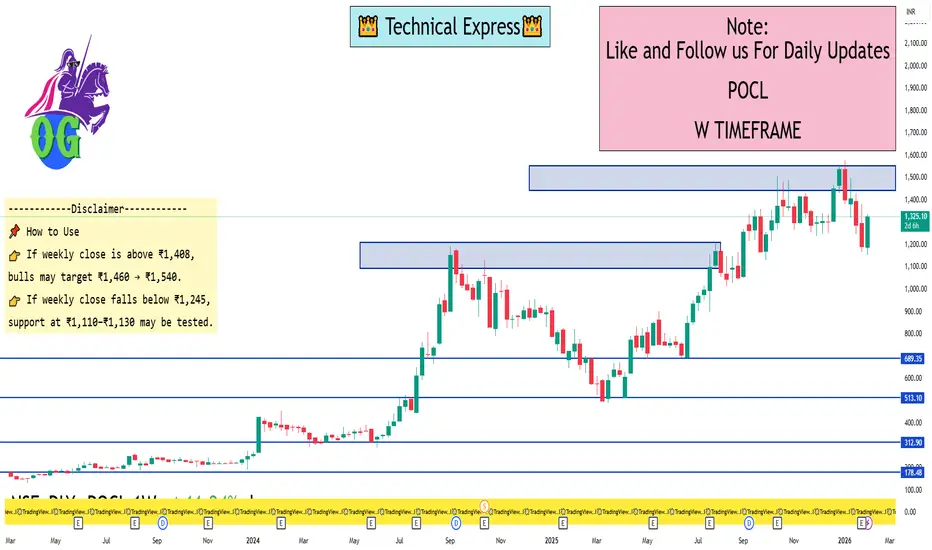
📌 Latest Approx Weekly Pivot Levels (calculated from recent weekly price action):
📈 Weekly Resistance Levels
R1: ~₹1,325–₹1,326
R2: ~₹1,459–₹1,469
R3: ~₹1,540–₹1,572
(Strong resistance zones where weekly price might struggle on the upside)
🔁 Weekly Pivot (Major Reference)
Weekly Pivot (central): ~₹1,407–₹1,408
(This is the main balance point for weekly price — above suggests short-term bullish bias, below indicates bearish bias)
📉 Weekly Support Levels
S1: ~₹1,245–₹1,248
S2: ~₹1,246–₹1,257 (variant levels across methods)
S3: ~₹1,113–₹1,113
S4: ~₹1,187–₹1,188 (from some pivot types)
(These are potential bounce zones if the weekly candle closes lower)
📌 Practical Weekly Level Summary (rounded zones)
Major weekly support zone: ₹1,110–₹1,250
Bullish pivot breakout zone: Above ~₹1,408
Upside target zones: ₹1,460 then ₹1,540+
Critical weekly support to maintain bullish bias: ~₹1,245
📊 Current price (recent trend)
The stock has been trading around ~₹1,300–₹1,330 range recently.
This places it around weekly pivot/slightly below R1, so weekly closes above ₹1,408–₹1,420 would confirm strength, while significant weekly closes below ₹1,245 might signal further weakness.
📈 Weekly Resistance Levels
R1: ~₹1,325–₹1,326
R2: ~₹1,459–₹1,469
R3: ~₹1,540–₹1,572
(Strong resistance zones where weekly price might struggle on the upside)
🔁 Weekly Pivot (Major Reference)
Weekly Pivot (central): ~₹1,407–₹1,408
(This is the main balance point for weekly price — above suggests short-term bullish bias, below indicates bearish bias)
📉 Weekly Support Levels
S1: ~₹1,245–₹1,248
S2: ~₹1,246–₹1,257 (variant levels across methods)
S3: ~₹1,113–₹1,113
S4: ~₹1,187–₹1,188 (from some pivot types)
(These are potential bounce zones if the weekly candle closes lower)
📌 Practical Weekly Level Summary (rounded zones)
Major weekly support zone: ₹1,110–₹1,250
Bullish pivot breakout zone: Above ~₹1,408
Upside target zones: ₹1,460 then ₹1,540+
Critical weekly support to maintain bullish bias: ~₹1,245
📊 Current price (recent trend)
The stock has been trading around ~₹1,300–₹1,330 range recently.
This places it around weekly pivot/slightly below R1, so weekly closes above ₹1,408–₹1,420 would confirm strength, while significant weekly closes below ₹1,245 might signal further weakness.

İlgili yayınlar
Feragatname
Bilgiler ve yayınlar, TradingView tarafından sağlanan veya onaylanan finansal, yatırım, alım satım veya diğer türden tavsiye veya öneriler anlamına gelmez ve teşkil etmez. Kullanım Koşulları bölümünde daha fazlasını okuyun.
İlgili yayınlar
Feragatname
Bilgiler ve yayınlar, TradingView tarafından sağlanan veya onaylanan finansal, yatırım, alım satım veya diğer türden tavsiye veya öneriler anlamına gelmez ve teşkil etmez. Kullanım Koşulları bölümünde daha fazlasını okuyun.