
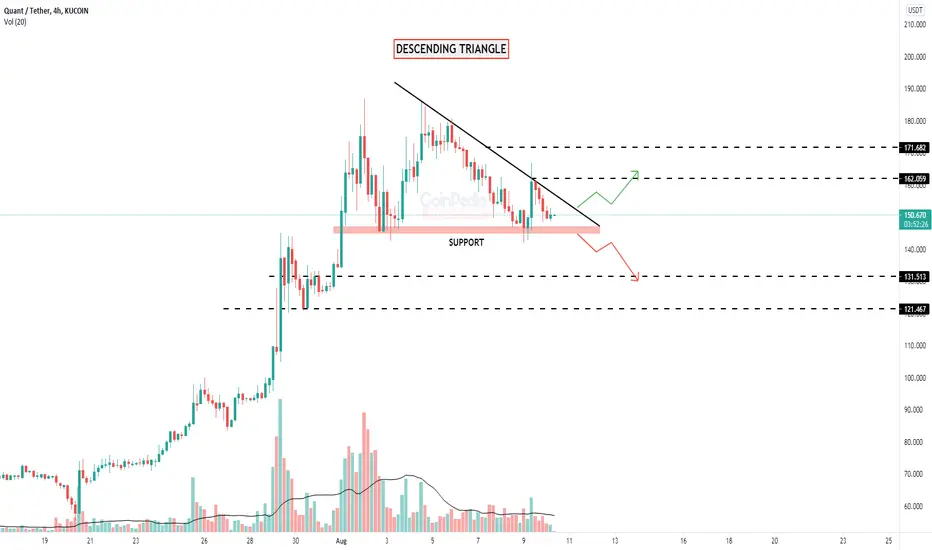
* Quant in 4H time frame forms a Descending triangle pattern, with the above trend-line as it's resistance and the support near $145.
* The Descending triangle is considered to be either bullish or bearish.
* If the price breaks either side of the pattern we can see healthy move.
* The Descending triangle is considered to be either bullish or bearish.
* If the price breaks either side of the pattern we can see healthy move.
Not
Breakout of the trend-line first target hit
Feragatname
Bilgiler ve yayınlar, TradingView tarafından sağlanan veya onaylanan finansal, yatırım, alım satım veya diğer türden tavsiye veya öneriler anlamına gelmez ve teşkil etmez. Kullanım Koşulları bölümünde daha fazlasını okuyun.
Feragatname
Bilgiler ve yayınlar, TradingView tarafından sağlanan veya onaylanan finansal, yatırım, alım satım veya diğer türden tavsiye veya öneriler anlamına gelmez ve teşkil etmez. Kullanım Koşulları bölümünde daha fazlasını okuyun.