
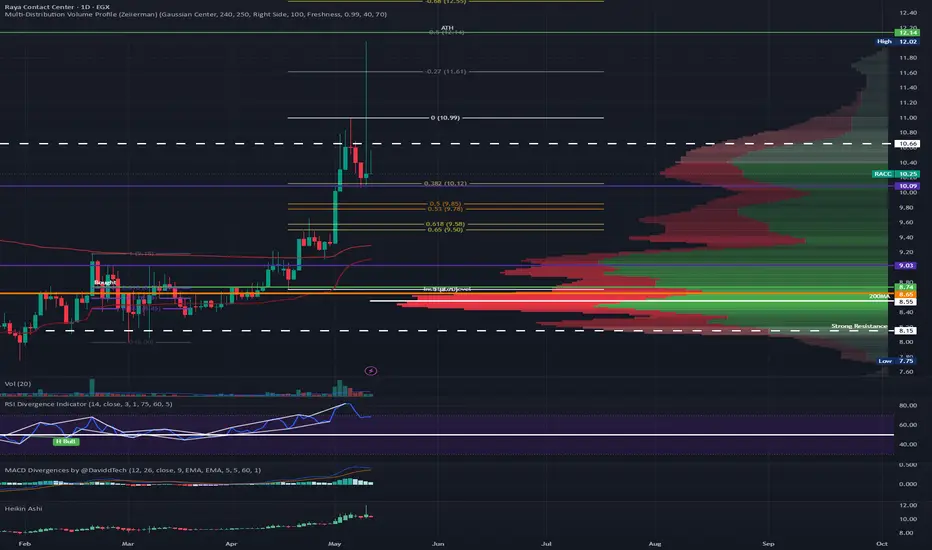
🚀 Recent Price Action:
RACC recently executed an extremely bullish wave, nearly testing its All-Time High (ATH) before being met with a significant profit-taking wave. 🌊💰
While the pullback was sharp, the price is currently consolidating above the 38% Fibonacci retracement level a very constructive sign that the primary uptrend is still intact. 🏗️✅
🚧 The 10.66 Barrier:
The stock is currently facing stiff rejection at the 10.66 resistance level. 🛡️
If the price attempts to test this level tomorrow and fails again, we should anticipate a deeper pullback next week. 📉📉
📉 Volume & Sentiment:
The decreasing volume during this consolidation suggests a lack of immediate buying pressure to overcome the 10.66 ceiling. 🔇
This exhaustion often precedes a secondary retracement to find more aggressive buyers at lower levels. 🕵️♂️💸
📝 Strategic Recommendation:
RACC remains bullish on the medium-to-long-term timeframes. 📈🌟
Entry Strategy: I recommend waiting for the completion of this pullback.
Look for "signs of positivity" (bullish reversal candles or volume spikes) at any key Fibonacci levels before initiating new long positions. 🛒💎
If you like my insights, follow and boost! 🙌💙🚀
🎁 $15 TradingView Discount:
🔗 tradingview.com/pricing/?share_your_love=mnmabroukw36ix ✨💸🤑
RACC recently executed an extremely bullish wave, nearly testing its All-Time High (ATH) before being met with a significant profit-taking wave. 🌊💰
While the pullback was sharp, the price is currently consolidating above the 38% Fibonacci retracement level a very constructive sign that the primary uptrend is still intact. 🏗️✅
🚧 The 10.66 Barrier:
The stock is currently facing stiff rejection at the 10.66 resistance level. 🛡️
If the price attempts to test this level tomorrow and fails again, we should anticipate a deeper pullback next week. 📉📉
📉 Volume & Sentiment:
The decreasing volume during this consolidation suggests a lack of immediate buying pressure to overcome the 10.66 ceiling. 🔇
This exhaustion often precedes a secondary retracement to find more aggressive buyers at lower levels. 🕵️♂️💸
📝 Strategic Recommendation:
RACC remains bullish on the medium-to-long-term timeframes. 📈🌟
Entry Strategy: I recommend waiting for the completion of this pullback.
Look for "signs of positivity" (bullish reversal candles or volume spikes) at any key Fibonacci levels before initiating new long positions. 🛒💎
If you like my insights, follow and boost! 🙌💙🚀
🎁 $15 TradingView Discount:
🔗 tradingview.com/pricing/?share_your_love=mnmabroukw36ix ✨💸🤑

İlgili yayınlar
Feragatname
Bilgiler ve yayınlar, TradingView tarafından sağlanan veya onaylanan finansal, yatırım, alım satım veya diğer türden tavsiye veya öneriler anlamına gelmez ve teşkil etmez. Kullanım Koşulları bölümünde daha fazlasını okuyun.
İlgili yayınlar
Feragatname
Bilgiler ve yayınlar, TradingView tarafından sağlanan veya onaylanan finansal, yatırım, alım satım veya diğer türden tavsiye veya öneriler anlamına gelmez ve teşkil etmez. Kullanım Koşulları bölümünde daha fazlasını okuyun.