RBS – Poised for bearish break
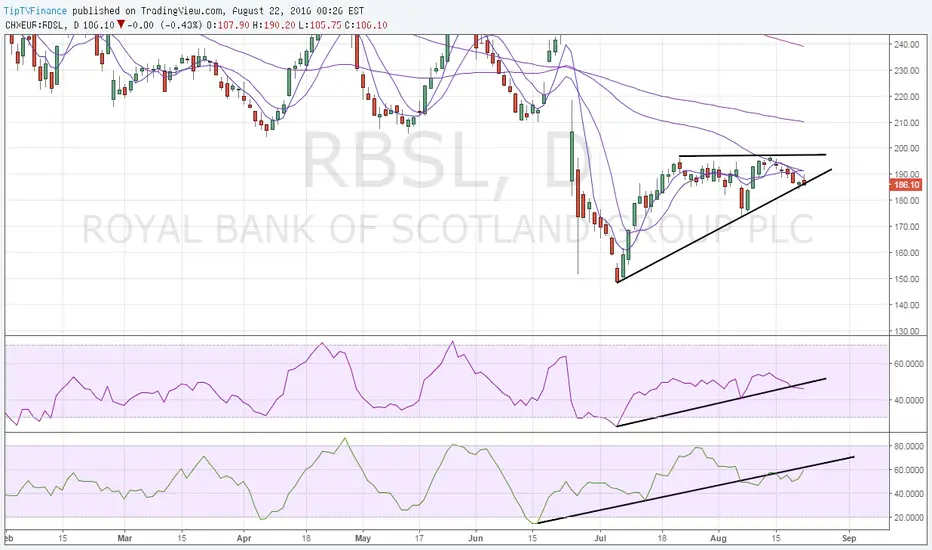
Daily chart pattern – Bearish breakout from rising wedge
Failure to hold above 50-DMA if followed by bearish break from rising wedge on day end closing basis coupled with daily RSI breaching rising trend line and falling money flow index would signal a sell-off to 173.80 (Aug 5 low).
On the higher side, only day end close above 50-DMA would signal bearish invalidation.
Failure to hold above 50-DMA if followed by bearish break from rising wedge on day end closing basis coupled with daily RSI breaching rising trend line and falling money flow index would signal a sell-off to 173.80 (Aug 5 low).
On the higher side, only day end close above 50-DMA would signal bearish invalidation.

İlgili yayınlar
Feragatname
Bilgiler ve yayınlar, TradingView tarafından sağlanan veya onaylanan finansal, yatırım, alım satım veya diğer türden tavsiye veya öneriler anlamına gelmez ve teşkil etmez. Kullanım Koşulları bölümünde daha fazlasını okuyun.
İlgili yayınlar
Feragatname
Bilgiler ve yayınlar, TradingView tarafından sağlanan veya onaylanan finansal, yatırım, alım satım veya diğer türden tavsiye veya öneriler anlamına gelmez ve teşkil etmez. Kullanım Koşulları bölümünde daha fazlasını okuyun.