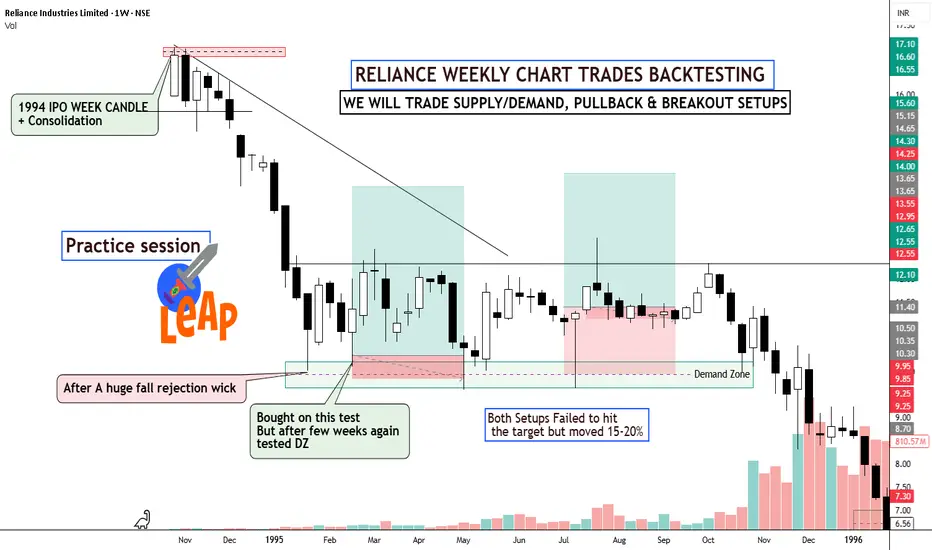
 RELIANCE
 Manual Backtesting Study | Supply–Demand • Pullbacks • Breakouts
I started from the weekly timeframe and moved the chart candle by candle, exactly the way price unfolds in real time.
The goal was simple:
⦿Understand where institutions likely accumulated or distributed
⦿Observe how price reacts at supply & demand zones
⦿Track pullback behavior in strong trends
⦿Validate breakouts only when structure and context align
Read the study Chart by chart
1.
2.
3.
4.
5.
6.
7.
8.
9.
10.
11.
12.
13.
14.
15.
16.
17.
Keep Learning,
Happy Trading.
İşlem aktif
Chart 17 we left it at the supply zone in few days it has fallen alot, the supply zone defended and it unfolded massive fall.
İlgili yayınlar
Feragatname
Bilgiler ve yayınlar, TradingView tarafından sağlanan veya onaylanan finansal, yatırım, alım satım veya diğer türden tavsiye veya öneriler anlamına gelmez ve teşkil etmez. Kullanım Koşulları bölümünde daha fazlasını okuyun.
İlgili yayınlar
Feragatname
Bilgiler ve yayınlar, TradingView tarafından sağlanan veya onaylanan finansal, yatırım, alım satım veya diğer türden tavsiye veya öneriler anlamına gelmez ve teşkil etmez. Kullanım Koşulları bölümünde daha fazlasını okuyun.