
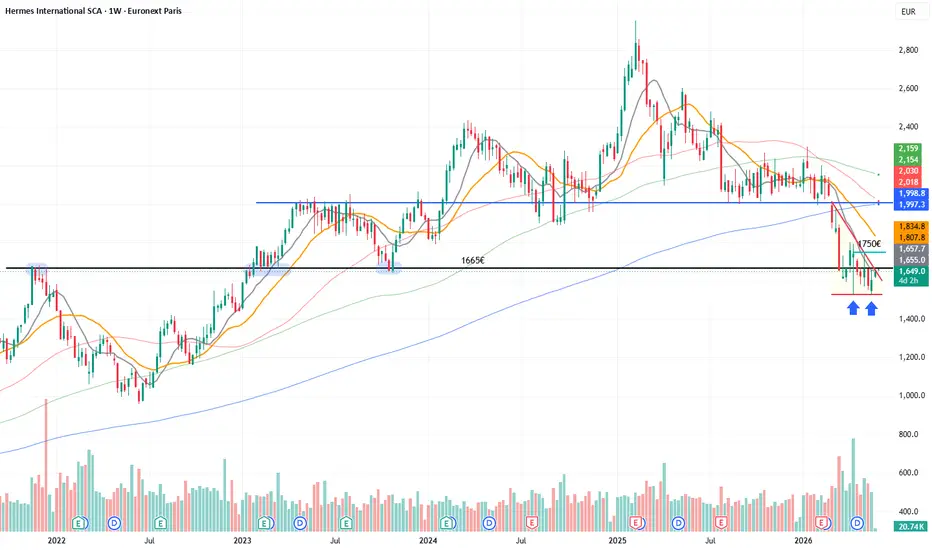
An interesting chart structure with two possible outcomes yet to be determined.
The price is moving within the red triangle and is currently near the upper boundary.
A bullish view suggests a potential breakout followed by the completion of a double bottom pattern, with the neckline at €1,750.
Conversely, in a bearish scenario, the price has just been rejected by the weekly SMA10 near the upper edge, with a probable return toward the bottom of the triangle, where a bearish breakout could follow.

I’ve noticed that many stocks in the luxury sector are currently sitting just below major resistance levels awaiting a breakout... what is about to happen?
This is just food for thought, as I believe the best move is to place some alert, wait and see which side of the triangle breaks first.
Keep a close eye on the volumes!
The price is moving within the red triangle and is currently near the upper boundary.
A bullish view suggests a potential breakout followed by the completion of a double bottom pattern, with the neckline at €1,750.
Conversely, in a bearish scenario, the price has just been rejected by the weekly SMA10 near the upper edge, with a probable return toward the bottom of the triangle, where a bearish breakout could follow.
I’ve noticed that many stocks in the luxury sector are currently sitting just below major resistance levels awaiting a breakout... what is about to happen?
This is just food for thought, as I believe the best move is to place some alert, wait and see which side of the triangle breaks first.
Keep a close eye on the volumes!

Feragatname
Bilgiler ve yayınlar, TradingView tarafından sağlanan veya onaylanan finansal, yatırım, alım satım veya diğer türden tavsiye veya öneriler anlamına gelmez ve teşkil etmez. Kullanım Koşulları bölümünde daha fazlasını okuyun.
Feragatname
Bilgiler ve yayınlar, TradingView tarafından sağlanan veya onaylanan finansal, yatırım, alım satım veya diğer türden tavsiye veya öneriler anlamına gelmez ve teşkil etmez. Kullanım Koşulları bölümünde daha fazlasını okuyun.