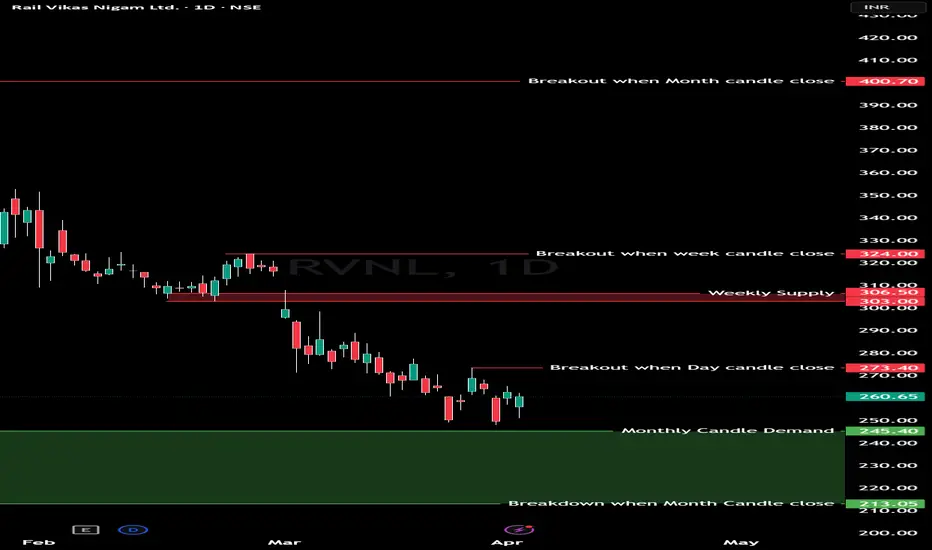
Rail Vikas Nigam Ltd. (RVNL)  RVNL is currently showing a significant correction from its recent highs and is approaching a crucial decision zone. This analysis highlights key Supply, Demand, and Breakout levels across Daily, Weekly, and Monthly timeframes.
📉 Support & Demand Zones
Monthly Demand Zone (₹245.40 - ₹213.05): The stock is hovering above a major demand area. The ₹245.40 level acts as the primary cushion for the bulls.
Crucial Breakdown Level (₹213.05): A Monthly candle closing below this level would signal a major structural breakdown and further downside.
📈 Resistance & Supply Zones
Immediate Daily Breakout (₹273.40): For a short-term trend reversal, we need to see a Daily candle close above this level.
Weekly Supply Zone (₹303.00 - ₹306.50): This is a "Role Reversal" zone where previous support is now acting as supply. Expect some selling pressure here.
Major Weekly Breakout (₹324.00): A Weekly candle close above this mark will confirm the return of bullish momentum, potentially heading towards previous highs.
🚀 Long-Term Target
Monthly Breakout (₹400.70): This is the ultimate resistance. A Monthly candle close above ₹400.70 opens the doors for a fresh multi-month rally and new highs.
Final Verdict & Strategy
Conservative Entry: Wait for a Weekly close above ₹324.00 for a high-probability long setup.
Aggressive Entry: Look for reversal signs (like a Hammer or Bullish Engulfing) near the ₹245.40 Monthly Demand level.
Risk Management: Keep a close eye on the ₹213.05 level on a closing basis.
Disclaimer: This analysis is for educational purposes only. Please perform your own due diligence or consult a financial advisor before making any investment decisions.
RVNL is currently showing a significant correction from its recent highs and is approaching a crucial decision zone. This analysis highlights key Supply, Demand, and Breakout levels across Daily, Weekly, and Monthly timeframes.📉 Support & Demand Zones
Monthly Demand Zone (₹245.40 - ₹213.05): The stock is hovering above a major demand area. The ₹245.40 level acts as the primary cushion for the bulls.
Crucial Breakdown Level (₹213.05): A Monthly candle closing below this level would signal a major structural breakdown and further downside.
📈 Resistance & Supply Zones
Immediate Daily Breakout (₹273.40): For a short-term trend reversal, we need to see a Daily candle close above this level.
Weekly Supply Zone (₹303.00 - ₹306.50): This is a "Role Reversal" zone where previous support is now acting as supply. Expect some selling pressure here.
Major Weekly Breakout (₹324.00): A Weekly candle close above this mark will confirm the return of bullish momentum, potentially heading towards previous highs.
🚀 Long-Term Target
Monthly Breakout (₹400.70): This is the ultimate resistance. A Monthly candle close above ₹400.70 opens the doors for a fresh multi-month rally and new highs.
Final Verdict & Strategy
Conservative Entry: Wait for a Weekly close above ₹324.00 for a high-probability long setup.
Aggressive Entry: Look for reversal signs (like a Hammer or Bullish Engulfing) near the ₹245.40 Monthly Demand level.
Risk Management: Keep a close eye on the ₹213.05 level on a closing basis.
Disclaimer: This analysis is for educational purposes only. Please perform your own due diligence or consult a financial advisor before making any investment decisions.

Feragatname
Bilgiler ve yayınlar, TradingView tarafından sağlanan veya onaylanan finansal, yatırım, alım satım veya diğer türden tavsiye veya öneriler anlamına gelmez ve teşkil etmez. Kullanım Koşulları bölümünde daha fazlasını okuyun.
Feragatname
Bilgiler ve yayınlar, TradingView tarafından sağlanan veya onaylanan finansal, yatırım, alım satım veya diğer türden tavsiye veya öneriler anlamına gelmez ve teşkil etmez. Kullanım Koşulları bölümünde daha fazlasını okuyun.