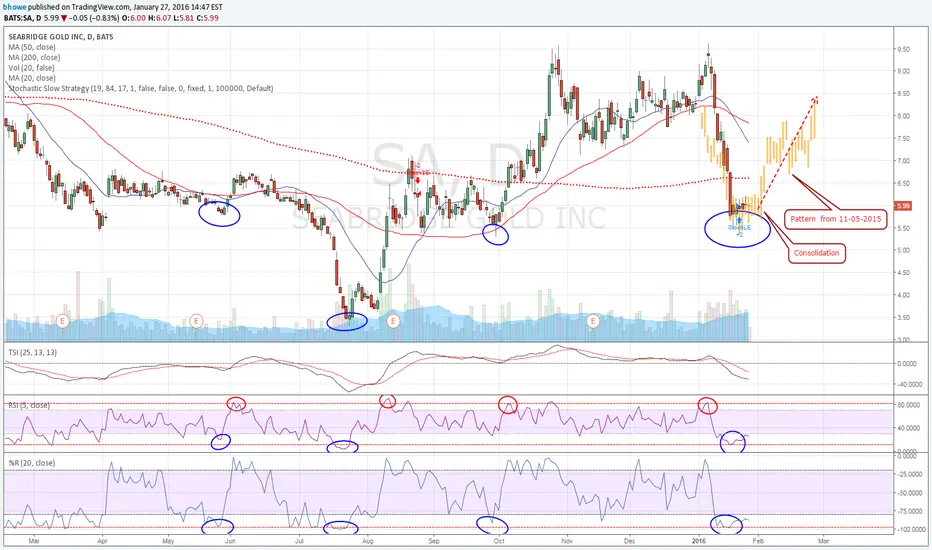
SA looks to be oversold (blue circles) and consolidating. RSI and %R are very oversold. Typically a run up is expected (but not always) into the red circle sell points. Stochastics strategy is indicating a Long Entry (LE). The pattern forming could look like a bear flag, but is very similar to a turn pattern from 11-5-2014 ( see gold bars). TSI looks to be starting a move higher. This is just a possibility. With gold and GDX moving higher I expect SA to join in.

Feragatname
Bilgiler ve yayınlar, TradingView tarafından sağlanan veya onaylanan finansal, yatırım, alım satım veya diğer türden tavsiye veya öneriler anlamına gelmez ve teşkil etmez. Kullanım Koşulları bölümünde daha fazlasını okuyun.
Feragatname
Bilgiler ve yayınlar, TradingView tarafından sağlanan veya onaylanan finansal, yatırım, alım satım veya diğer türden tavsiye veya öneriler anlamına gelmez ve teşkil etmez. Kullanım Koşulları bölümünde daha fazlasını okuyun.