
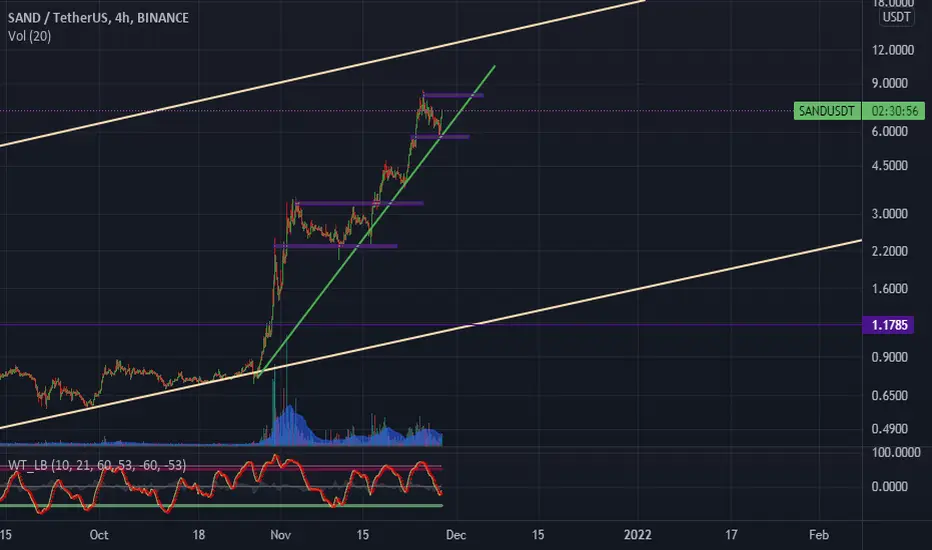
sand usdt analyses
time frame 4 Hours
we can see green uptrend line( short term) between two creme uptrend line (long term)
we can see when price hits green line , price reacts and grows
also we can see when wave is going up in indicator in bottom of chart . when price hit the green line
sorry for my very very bad English but I hope it was useful for you

Feragatname
Bilgiler ve yayınlar, TradingView tarafından sağlanan veya onaylanan finansal, yatırım, alım satım veya diğer türden tavsiye veya öneriler anlamına gelmez ve teşkil etmez. Kullanım Koşulları bölümünde daha fazlasını okuyun.
Feragatname
Bilgiler ve yayınlar, TradingView tarafından sağlanan veya onaylanan finansal, yatırım, alım satım veya diğer türden tavsiye veya öneriler anlamına gelmez ve teşkil etmez. Kullanım Koşulları bölümünde daha fazlasını okuyun.