
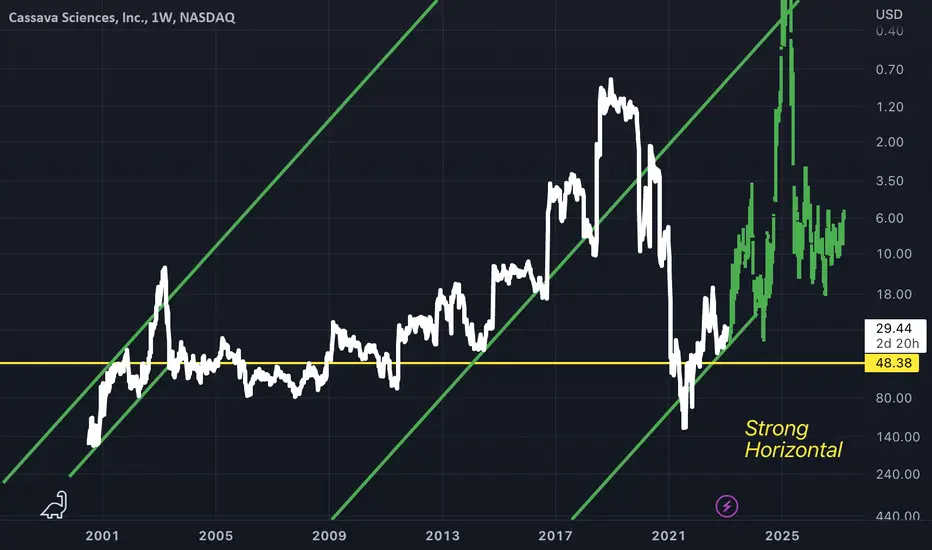
Slanted Double Bottom
This can be also observed earlier in prices history, again along the strong horizontal in yellow which is the most important take away from this chart
Bars pattern placed in green is just an example of how price could recover
Bullish above the horizontal
This can be also observed earlier in prices history, again along the strong horizontal in yellow which is the most important take away from this chart
Bars pattern placed in green is just an example of how price could recover
Bullish above the horizontal

Feragatname
Bilgiler ve yayınlar, TradingView tarafından sağlanan veya onaylanan finansal, yatırım, alım satım veya diğer türden tavsiye veya öneriler anlamına gelmez ve teşkil etmez. Kullanım Koşulları bölümünde daha fazlasını okuyun.
Feragatname
Bilgiler ve yayınlar, TradingView tarafından sağlanan veya onaylanan finansal, yatırım, alım satım veya diğer türden tavsiye veya öneriler anlamına gelmez ve teşkil etmez. Kullanım Koşulları bölümünde daha fazlasını okuyun.