
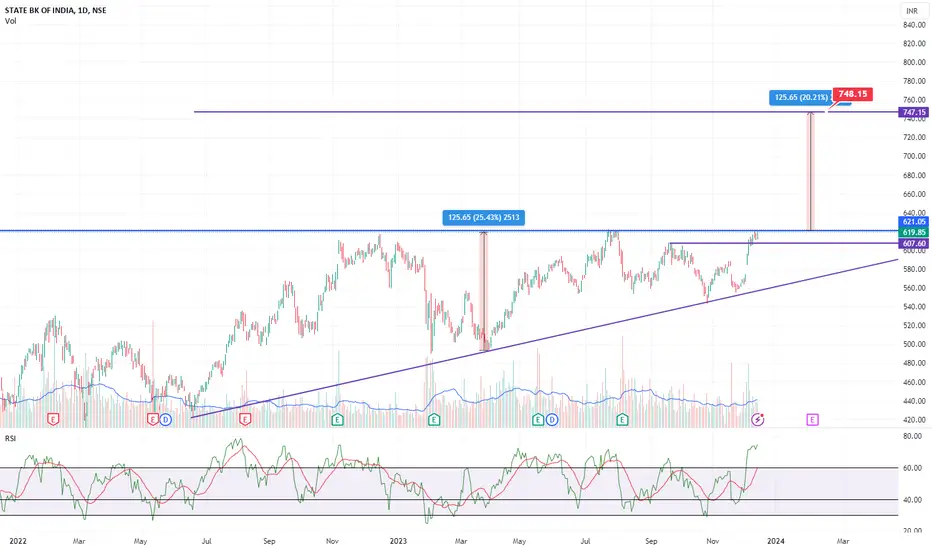
SBI form triangle pattern on weekly chart. If break and sustain above 620 weekly. It may test700-750 in next 2-3 months.
İşlem aktif
Activeİşlem aktif
Activeİşlem aktif
Now all loose hand out from stock and strong hands riding towards 740. It will go festered towards target now.So stay hold
İşlem kapandı: hedefe ulaştı
SBI target done 740+Enjoy the bumper profit.

Feragatname
Bilgiler ve yayınlar, TradingView tarafından sağlanan veya onaylanan finansal, yatırım, alım satım veya diğer türden tavsiye veya öneriler anlamına gelmez ve teşkil etmez. Kullanım Koşulları bölümünde daha fazlasını okuyun.
Feragatname
Bilgiler ve yayınlar, TradingView tarafından sağlanan veya onaylanan finansal, yatırım, alım satım veya diğer türden tavsiye veya öneriler anlamına gelmez ve teşkil etmez. Kullanım Koşulları bölümünde daha fazlasını okuyun.