
💡 Swing setup idea
Resistance breakout / ascending triangle pattern
🔎 Analysis summary:
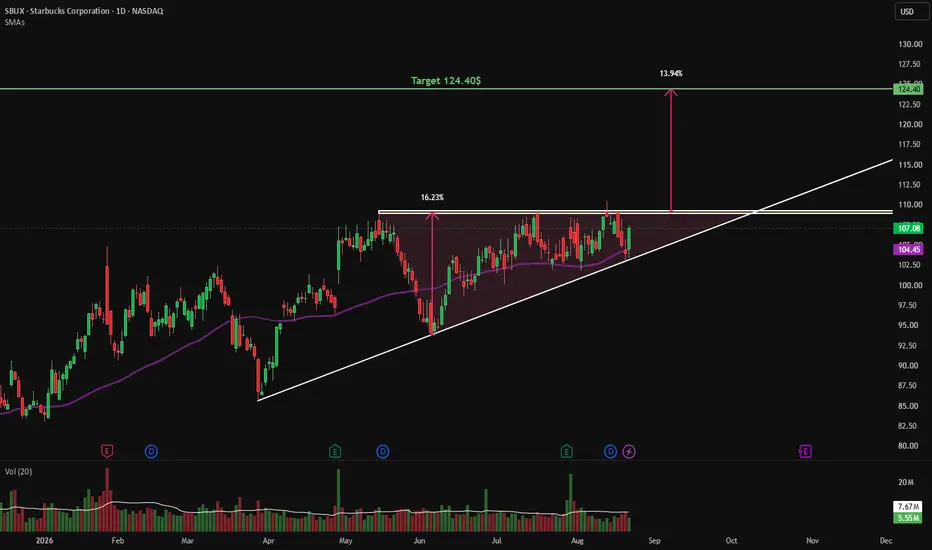
The price is hovering around the 50 SMA, but we can spot an ascending triangle forming and pushing close to resistance . The upside potential is projected by the depth/height of the pattern from the breakout point.
👀 Levels to watch:
Entry trigger: Break above $109.25
Target: $124.40
Stop: Under the breakout level
💬 Will the stock break through resistance this time? Let me know in the comments! 👇
Good luck!
⚠️ Note: This is for educational purposes only and is not financial advice.
Resistance breakout / ascending triangle pattern
🔎 Analysis summary:
The price is hovering around the 50 SMA, but we can spot an ascending triangle forming and pushing close to resistance . The upside potential is projected by the depth/height of the pattern from the breakout point.
👀 Levels to watch:
Entry trigger: Break above $109.25
Target: $124.40
Stop: Under the breakout level
💬 Will the stock break through resistance this time? Let me know in the comments! 👇
Good luck!
⚠️ Note: This is for educational purposes only and is not financial advice.

📈 Follow for more swing setups & market analysis!
🎯 Want my opinion on a specific stock?
Hit the link below👇
ko-fi.com/c/82990ede9f
🎯 Want my opinion on a specific stock?
Hit the link below👇
ko-fi.com/c/82990ede9f
Feragatname
Bilgiler ve yayınlar, TradingView tarafından sağlanan veya onaylanan finansal, yatırım, alım satım veya diğer türden tavsiye veya öneriler anlamına gelmez ve teşkil etmez. Kullanım Koşulları bölümünde daha fazlasını okuyun.
📈 Follow for more swing setups & market analysis!
🎯 Want my opinion on a specific stock?
Hit the link below👇
ko-fi.com/c/82990ede9f
🎯 Want my opinion on a specific stock?
Hit the link below👇
ko-fi.com/c/82990ede9f
Feragatname
Bilgiler ve yayınlar, TradingView tarafından sağlanan veya onaylanan finansal, yatırım, alım satım veya diğer türden tavsiye veya öneriler anlamına gelmez ve teşkil etmez. Kullanım Koşulları bölümünde daha fazlasını okuyun.