
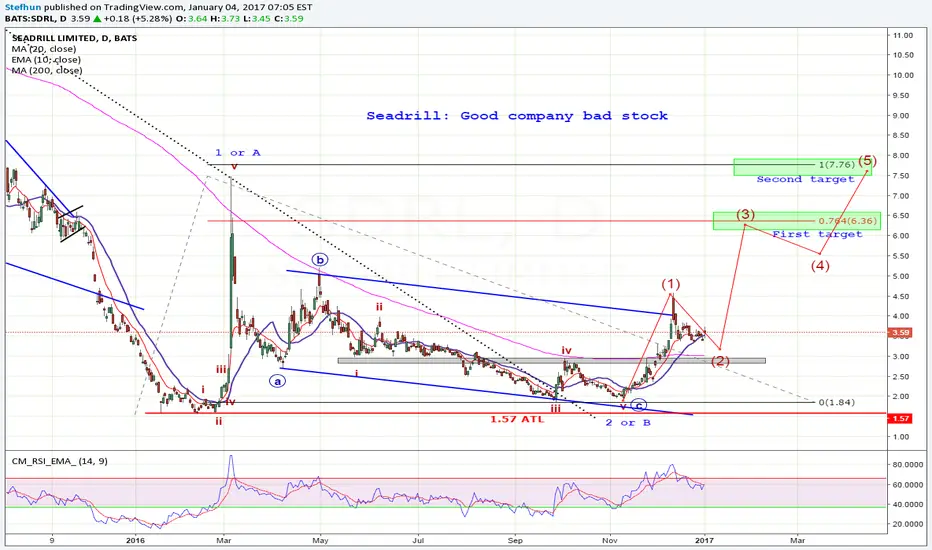
Stock went down from very high price to $1.57. Consolidation in progress.
This chart show that a good company can have a bad stock... I think this is a corrective movement after hit the $1.57 ATL
Flat to the upside... so, I do give a bigger probability to the ABC correction rather than impusle wave.
This is a daily chart but count based on weekly. Let's see how it will develop...

Feragatname
Bilgiler ve yayınlar, TradingView tarafından sağlanan veya onaylanan finansal, yatırım, alım satım veya diğer türden tavsiye veya öneriler anlamına gelmez ve teşkil etmez. Kullanım Koşulları bölümünde daha fazlasını okuyun.
Feragatname
Bilgiler ve yayınlar, TradingView tarafından sağlanan veya onaylanan finansal, yatırım, alım satım veya diğer türden tavsiye veya öneriler anlamına gelmez ve teşkil etmez. Kullanım Koşulları bölümünde daha fazlasını okuyun.