
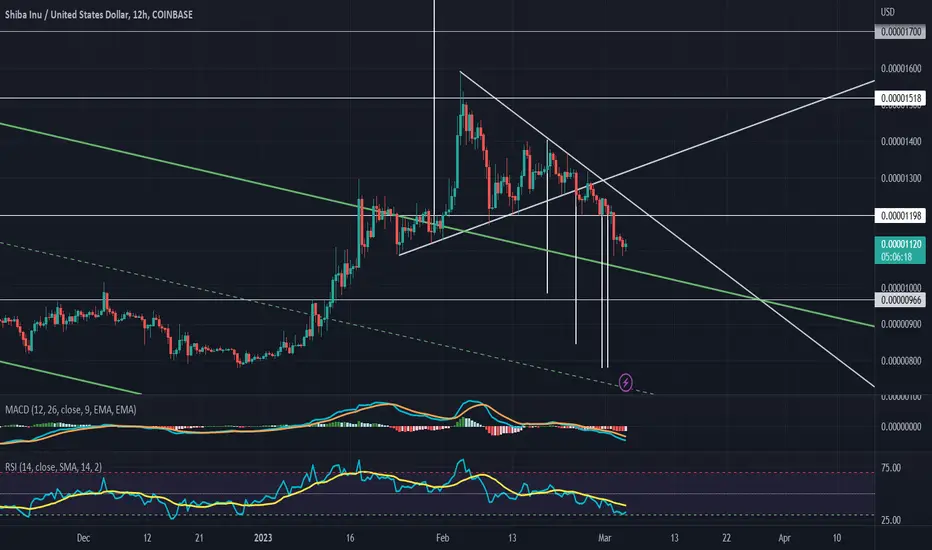
12-Hour Chart: Broke under the neckline of the head-and-shoulders. Then confirmed SHIBUSD to be in a descending triangle. Broke under the support of the descending triangle. Measuring the move from the top of the head of the head-and-shoulders to the support line of the descending triangle and moving that measurement down under the support line of the descending triangle, SHIBUSD should eventually see $ 0.00000780..

Feragatname
Bilgiler ve yayınlar, TradingView tarafından sağlanan veya onaylanan finansal, yatırım, alım satım veya diğer türden tavsiye veya öneriler anlamına gelmez ve teşkil etmez. Kullanım Koşulları bölümünde daha fazlasını okuyun.
Feragatname
Bilgiler ve yayınlar, TradingView tarafından sağlanan veya onaylanan finansal, yatırım, alım satım veya diğer türden tavsiye veya öneriler anlamına gelmez ve teşkil etmez. Kullanım Koşulları bölümünde daha fazlasını okuyun.