SHOPIFY Bottom Potential
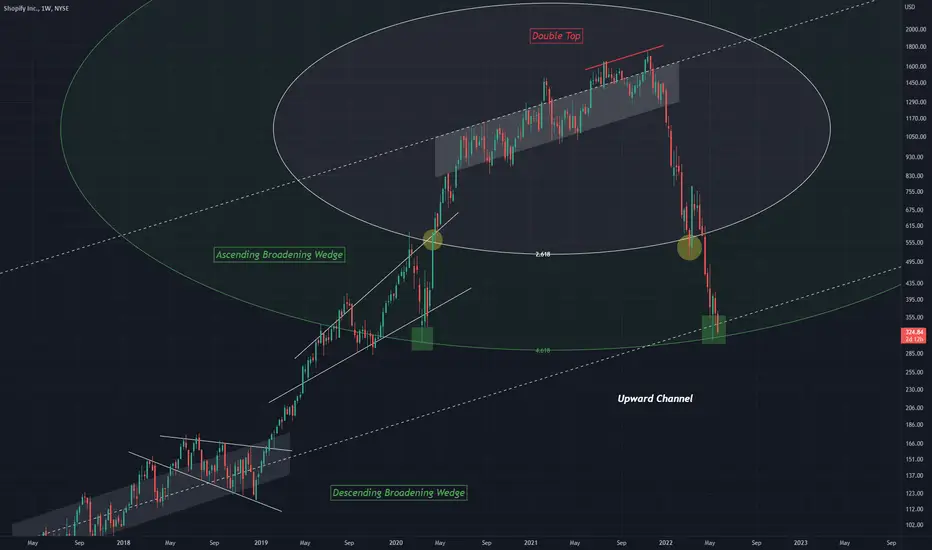
An upward channel can be drawn from a strong trend line point on SHOPIFY
It provides a chart like this, showing a clear top, and also a potential bottom that aligns with the 4.618 fib
An attempted support can be seen to have formed at 2.618 (yellow)
This leaves 4.618 as a bottom point, which has also been seen as a bottom in the past (green)
Two bullish chart patterns can be seen on chart along with one bearish
Ascending and Descending wedge both acting bullishly
Followed by a Double top, considered a bearish pattern
It provides a chart like this, showing a clear top, and also a potential bottom that aligns with the 4.618 fib
An attempted support can be seen to have formed at 2.618 (yellow)
This leaves 4.618 as a bottom point, which has also been seen as a bottom in the past (green)
Two bullish chart patterns can be seen on chart along with one bearish
Ascending and Descending wedge both acting bullishly
Followed by a Double top, considered a bearish pattern

Feragatname
Bilgiler ve yayınlar, TradingView tarafından sağlanan veya onaylanan finansal, yatırım, alım satım veya diğer türden tavsiye veya öneriler anlamına gelmez ve teşkil etmez. Kullanım Koşulları bölümünde daha fazlasını okuyun.
Feragatname
Bilgiler ve yayınlar, TradingView tarafından sağlanan veya onaylanan finansal, yatırım, alım satım veya diğer türden tavsiye veya öneriler anlamına gelmez ve teşkil etmez. Kullanım Koşulları bölümünde daha fazlasını okuyun.