
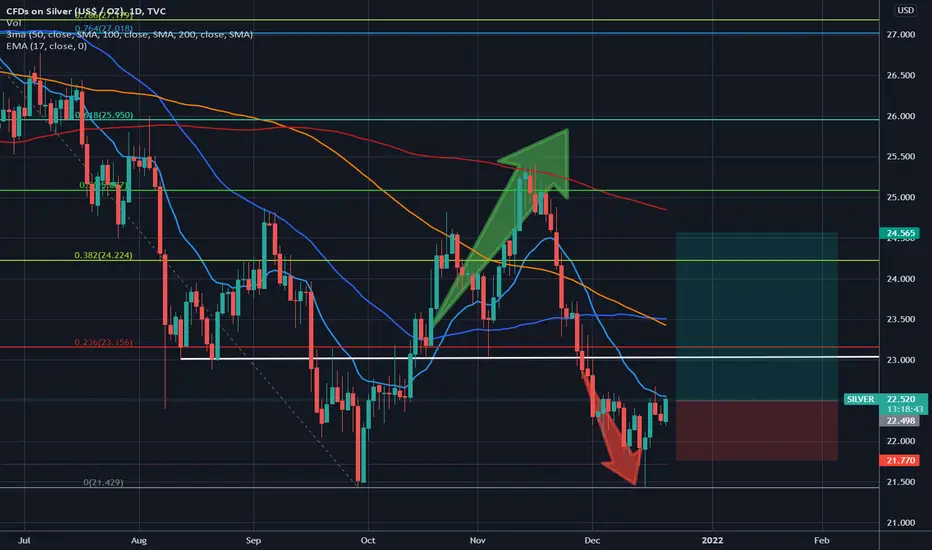
From the first low at the beginning of October until now, it seems like silver has formed a double-bottom chart formation. Furthermore, since the beginning of December, the chart pattern looks like an inverse shoulder-head-shoulder-formation. So we have two signs of going long in this chart. At least until ~22.50 USD, and then we might need to re-evaluate the situation.

Feragatname
Bilgiler ve yayınlar, TradingView tarafından sağlanan veya onaylanan finansal, yatırım, alım satım veya diğer türden tavsiye veya öneriler anlamına gelmez ve teşkil etmez. Kullanım Koşulları bölümünde daha fazlasını okuyun.
Feragatname
Bilgiler ve yayınlar, TradingView tarafından sağlanan veya onaylanan finansal, yatırım, alım satım veya diğer türden tavsiye veya öneriler anlamına gelmez ve teşkil etmez. Kullanım Koşulları bölümünde daha fazlasını okuyun.