
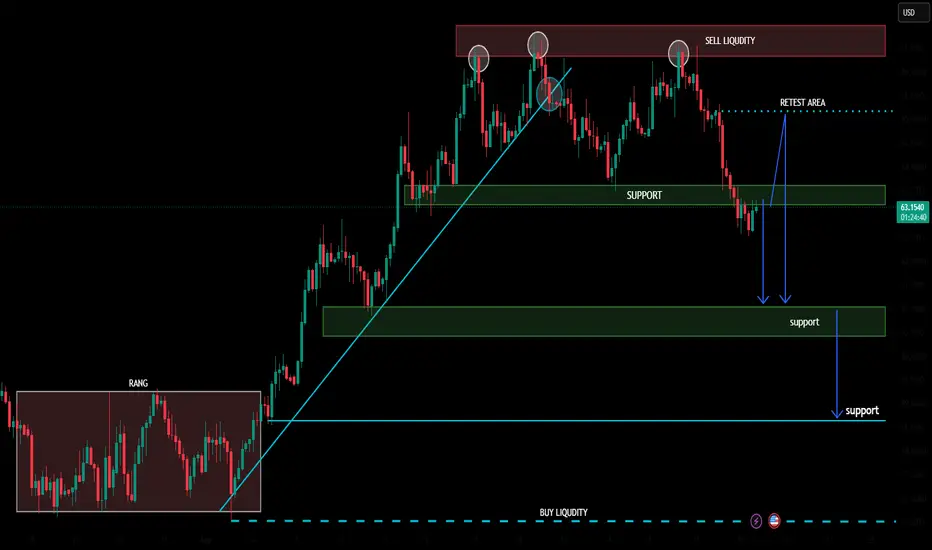
Technical Analysis | Retest & Key Targets 📊
Price is currently around 63.22 and has pulled back into the marked support zone after rejecting the sell-liquidity area near the recent highs.
📌 Resistance / Retest Area
• 65.00–65.20 — key retest zone
• 66.20–66.60 — major resistance / sell-liquidity zone
📌 Support Levels
• S1: 63.00–63.50
• S2: 60.50–61.00
• S3: 58.60–58.80
• Major lower liquidity: ~56.60
🎯 Bullish Targets
If the current support holds and price reclaims 65.00–65.20:
• Target 1: 65.20
• Target 2: 66.20
• Target 3: 66.50–66.60 🎯
📉 Bearish Scenario
If price loses the 63.00–63.50 support zone, the next marked levels become:
• Target 1: 61.00
• Target 2: 60.50
• Target 3: 58.60–58.80 🎯
📊 Technical View
The chart shows a pullback from the upper sell-liquidity zone into support. The 63.00–63.50 area is the key decision zone. A successful hold and reclaim of 65.00–65.20 would favor a move back toward the upper liquidity area, while a confirmed breakdown below support could expose the lower support zones.
⚠️ Risk Management
This is chart-based technical analysis and represents potential scenarios, not guaranteed results or financial advice. Wait for confirmation and manage risk according to your own strategy.
İşlem aktif
ACTIVE NOW 
İlgili yayınlar
Feragatname
Bilgiler ve yayınlar, TradingView tarafından sağlanan veya onaylanan finansal, yatırım, alım satım veya diğer türden tavsiye veya öneriler anlamına gelmez ve teşkil etmez. Kullanım Koşulları bölümünde daha fazlasını okuyun.
İlgili yayınlar
Feragatname
Bilgiler ve yayınlar, TradingView tarafından sağlanan veya onaylanan finansal, yatırım, alım satım veya diğer türden tavsiye veya öneriler anlamına gelmez ve teşkil etmez. Kullanım Koşulları bölümünde daha fazlasını okuyun.