
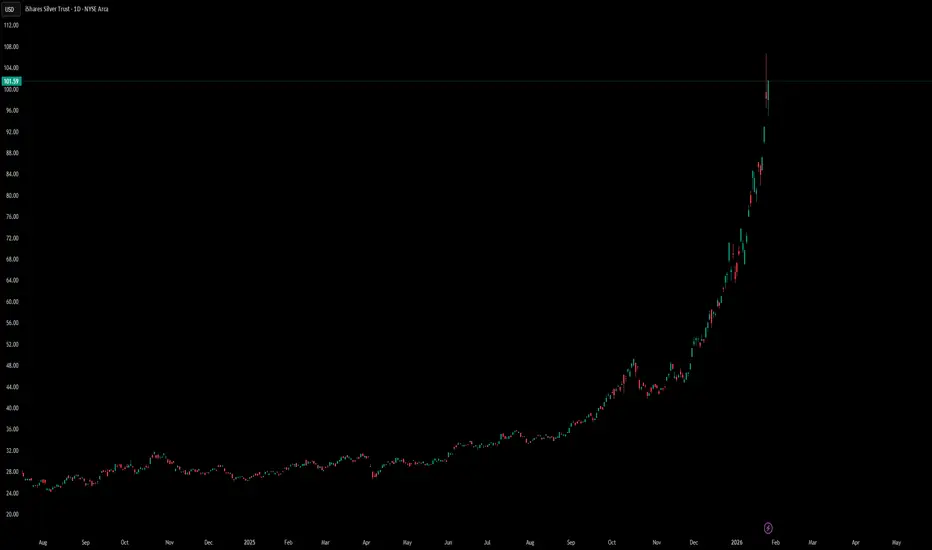
The SLV chart depicts a massive "blow-off top" or hyper-growth phase. The momentum is aggressively to the upside, but the distance from the nearest technical support (27.66) indicates the asset is significantly over-extended from its mean.
Bull Case: Momentum is dominant. With no overhead resistance, the price can theoretically run until buyer exhaustion occurs.
Bear/Risk Case: The vertical ascent leaves the asset vulnerable to sharp, volatile corrections, as there is little established market structure between 101 and 30 to catch a falling price.
Bull Case: Momentum is dominant. With no overhead resistance, the price can theoretically run until buyer exhaustion occurs.
Bear/Risk Case: The vertical ascent leaves the asset vulnerable to sharp, volatile corrections, as there is little established market structure between 101 and 30 to catch a falling price.

Feragatname
Bilgiler ve yayınlar, TradingView tarafından sağlanan veya onaylanan finansal, yatırım, alım satım veya diğer türden tavsiye veya öneriler anlamına gelmez ve teşkil etmez. Kullanım Koşulları bölümünde daha fazlasını okuyun.
Feragatname
Bilgiler ve yayınlar, TradingView tarafından sağlanan veya onaylanan finansal, yatırım, alım satım veya diğer türden tavsiye veya öneriler anlamına gelmez ve teşkil etmez. Kullanım Koşulları bölümünde daha fazlasını okuyun.