
Ho, this baby ar screaming to be shortened! :D
Take a look at W, H1 and yes D chart here.
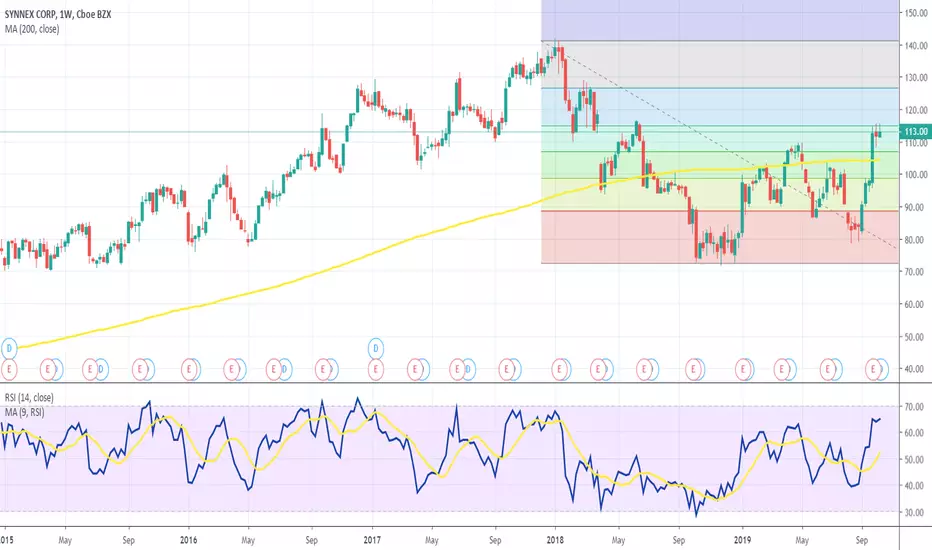
RSI is highly overbought, and value is floating in that area for some time, which is one of the clearest signals of possible price movement change.
Fibonacci on W time frame, 61.8 is to strong resistance level, for now.
My play is sell short with R/R 2:7
Take a look at W, H1 and yes D chart here.
RSI is highly overbought, and value is floating in that area for some time, which is one of the clearest signals of possible price movement change.
Fibonacci on W time frame, 61.8 is to strong resistance level, for now.
My play is sell short with R/R 2:7

Feragatname
Bilgiler ve yayınlar, TradingView tarafından sağlanan veya onaylanan finansal, yatırım, alım satım veya diğer türden tavsiye veya öneriler anlamına gelmez ve teşkil etmez. Kullanım Koşulları bölümünde daha fazlasını okuyun.
Feragatname
Bilgiler ve yayınlar, TradingView tarafından sağlanan veya onaylanan finansal, yatırım, alım satım veya diğer türden tavsiye veya öneriler anlamına gelmez ve teşkil etmez. Kullanım Koşulları bölümünde daha fazlasını okuyun.