
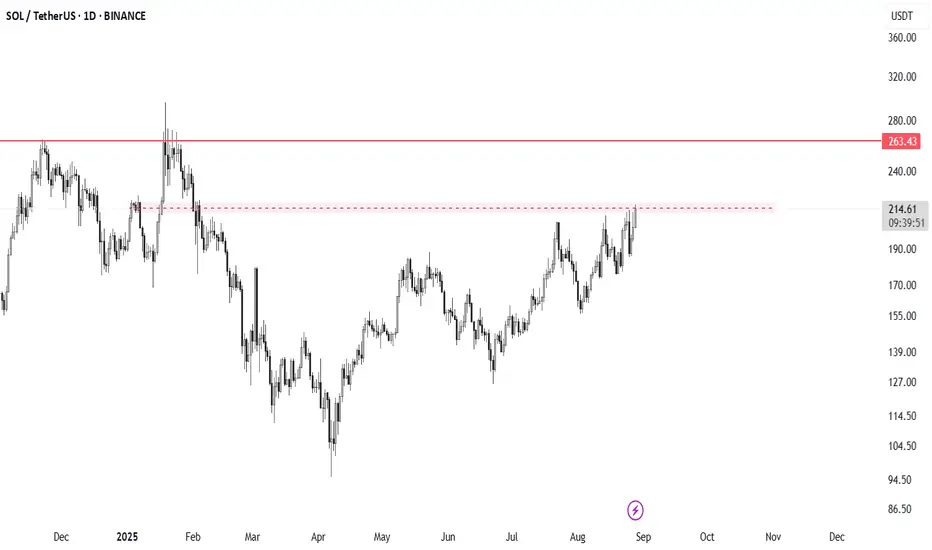
Price is currently trading around $214, right below a strong resistance zone near $230–$235. In the past, this level acted as supply, pushing the price down.
The chart shows a short setup with a stop loss above resistance and a target around $130, which is the next strong support area.
In simple terms:
If the price fails to break above $230, it could drop towards $130.
If it breaks and closes strongly above $230, the bearish setup becomes invalid, and the next resistance is around $263.
This setup is based on the idea that price is retesting an important resistance after a big rally.

İlgili yayınlar
Feragatname
Bilgiler ve yayınlar, TradingView tarafından sağlanan veya onaylanan finansal, yatırım, alım satım veya diğer türden tavsiye veya öneriler anlamına gelmez ve teşkil etmez. Kullanım Koşulları bölümünde daha fazlasını okuyun.
Feragatname
Bilgiler ve yayınlar, TradingView tarafından sağlanan veya onaylanan finansal, yatırım, alım satım veya diğer türden tavsiye veya öneriler anlamına gelmez ve teşkil etmez. Kullanım Koşulları bölümünde daha fazlasını okuyun.