
Structural Comparison to BTC — The Critical Divergence
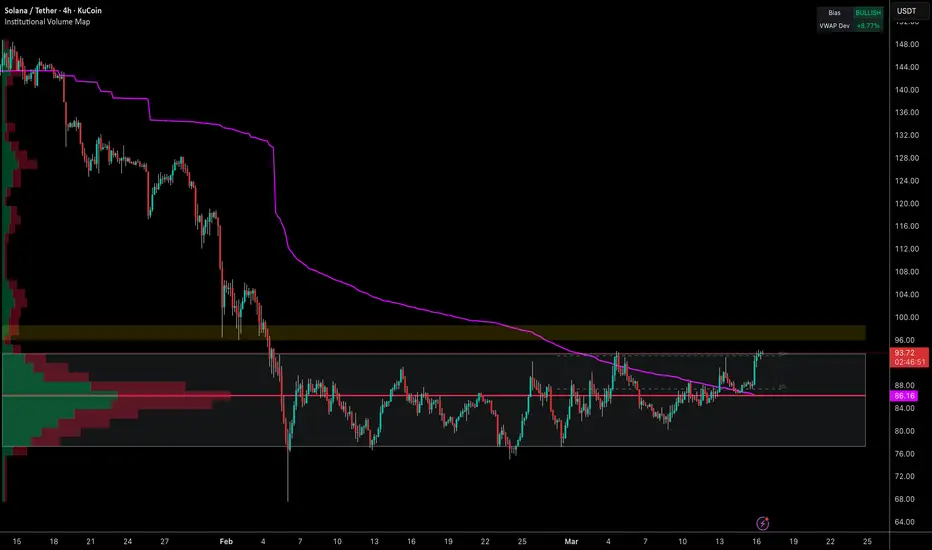
The first thing to note when reading this chart alongside BTC: Solana's AVWAP (purple line) has not yet flattened. It is still descending — slowly, but descending. Compare this directly to BTC where the AVWAP has stabilized and begun curling upward. That distinction is not cosmetic.
A still-falling AVWAP on SOL means the institutional reference point is still resetting lower, even as price pushes higher intraday.
SOL is registering BULLISH bias with +8.91% VWAP deviation — but that deviation is being measured against a reference point that is still moving down. The headline reads better than the structure underneath it.
The +8.91% Deviation in Context
On the surface, +8.91% deviation appears constructive. But this reading demands more scrutiny on SOL than on BTC for two reasons. First, the AVWAP it's measured against is still falling — so the deviation is partly a function of price temporarily outrunning a declining reference point, not price reclaiming a stable institutional anchor.
Second, SOL's February low was approximately -45% VWAP deviation. The recovery from extreme negative deviation to +8.91% positive is a large swing, but it has occurred without the volume consolidation structure that would make it durable.
This is the EXPANDED compression signature: violent price swings in both directions, no stable base forming, the volume profile still dispersed across a wide range.
The AVWAP Convergence Test
The most important structural development to monitor on this chart is whether the descending AVWAP and rising price converge into a crossover. The AVWAP is currently somewhere in the $86–$88 zone based on its trajectory. Price at $93.84 is above it — but only because price spiked upward faster than the AVWAP has moved.
A genuine regime shift on SOL requires price to hold above the AVWAP after it stabilizes, not simply gap above a still-falling line. If price pulls back toward $86–$88 and the AVWAP catches up and flattens at that level, then holds — that is the accumulation fingerprint. If price pulls back through $86.16 while the AVWAP is still falling, the structure remains bearish.
Cantillon Flow Positioning
SOL sits further along the risk spectrum than BTC — it is a higher-beta, later-in-sequence asset within the Cantillon framework. BTC receives institutional flow before SOL does. The fact that BTC's AVWAP has stabilized while SOL's has not is consistent with that sequencing. The flow is arriving at BTC. It has not yet fully reached SOL.
This does not mean SOL cannot move higher — clearly it can, as today's +8.91% reading demonstrates. It means the structural confirmation that would make a position in SOL defensible from a volume framework standpoint is not yet in place.
Summary Read
The bias reads BULLISH. The structure reads incomplete. Until the AVWAP flattens, the $96–$100 Golden pocket zone is cleared, and price consolidates above the institutional reference point rather than simply spiking through it — SOL is trading on momentum, not on confirmed institutional regime change.
Regime first. Volume second. Price last.
The first thing to note when reading this chart alongside BTC: Solana's AVWAP (purple line) has not yet flattened. It is still descending — slowly, but descending. Compare this directly to BTC where the AVWAP has stabilized and begun curling upward. That distinction is not cosmetic.
A still-falling AVWAP on SOL means the institutional reference point is still resetting lower, even as price pushes higher intraday.
SOL is registering BULLISH bias with +8.91% VWAP deviation — but that deviation is being measured against a reference point that is still moving down. The headline reads better than the structure underneath it.
The +8.91% Deviation in Context
On the surface, +8.91% deviation appears constructive. But this reading demands more scrutiny on SOL than on BTC for two reasons. First, the AVWAP it's measured against is still falling — so the deviation is partly a function of price temporarily outrunning a declining reference point, not price reclaiming a stable institutional anchor.
Second, SOL's February low was approximately -45% VWAP deviation. The recovery from extreme negative deviation to +8.91% positive is a large swing, but it has occurred without the volume consolidation structure that would make it durable.
This is the EXPANDED compression signature: violent price swings in both directions, no stable base forming, the volume profile still dispersed across a wide range.
The AVWAP Convergence Test
The most important structural development to monitor on this chart is whether the descending AVWAP and rising price converge into a crossover. The AVWAP is currently somewhere in the $86–$88 zone based on its trajectory. Price at $93.84 is above it — but only because price spiked upward faster than the AVWAP has moved.
A genuine regime shift on SOL requires price to hold above the AVWAP after it stabilizes, not simply gap above a still-falling line. If price pulls back toward $86–$88 and the AVWAP catches up and flattens at that level, then holds — that is the accumulation fingerprint. If price pulls back through $86.16 while the AVWAP is still falling, the structure remains bearish.
Cantillon Flow Positioning
SOL sits further along the risk spectrum than BTC — it is a higher-beta, later-in-sequence asset within the Cantillon framework. BTC receives institutional flow before SOL does. The fact that BTC's AVWAP has stabilized while SOL's has not is consistent with that sequencing. The flow is arriving at BTC. It has not yet fully reached SOL.
This does not mean SOL cannot move higher — clearly it can, as today's +8.91% reading demonstrates. It means the structural confirmation that would make a position in SOL defensible from a volume framework standpoint is not yet in place.
Summary Read
The bias reads BULLISH. The structure reads incomplete. Until the AVWAP flattens, the $96–$100 Golden pocket zone is cleared, and price consolidates above the institutional reference point rather than simply spiking through it — SOL is trading on momentum, not on confirmed institutional regime change.
Regime first. Volume second. Price last.

Daily top picks analysis → free & paid tiers
Custom Institutional volume terminal included with paid sub
thecantillonreport.substack.com/?utm_source=tradingview
cantillonresearch.com/
youtube.com/@cantillonresearch
Custom Institutional volume terminal included with paid sub
thecantillonreport.substack.com/?utm_source=tradingview
cantillonresearch.com/
youtube.com/@cantillonresearch
Feragatname
Bilgiler ve yayınlar, TradingView tarafından sağlanan veya onaylanan finansal, yatırım, alım satım veya diğer türden tavsiye veya öneriler anlamına gelmez ve teşkil etmez. Kullanım Koşulları bölümünde daha fazlasını okuyun.
Daily top picks analysis → free & paid tiers
Custom Institutional volume terminal included with paid sub
thecantillonreport.substack.com/?utm_source=tradingview
cantillonresearch.com/
youtube.com/@cantillonresearch
Custom Institutional volume terminal included with paid sub
thecantillonreport.substack.com/?utm_source=tradingview
cantillonresearch.com/
youtube.com/@cantillonresearch
Feragatname
Bilgiler ve yayınlar, TradingView tarafından sağlanan veya onaylanan finansal, yatırım, alım satım veya diğer türden tavsiye veya öneriler anlamına gelmez ve teşkil etmez. Kullanım Koşulları bölümünde daha fazlasını okuyun.