
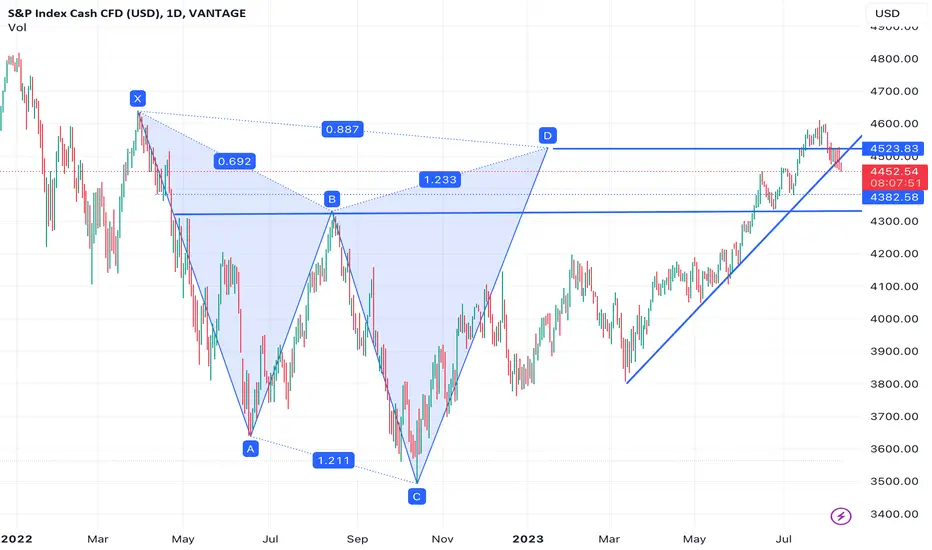
Retrace more than upward trend line. Hold for at least a few days to see outcome.
Cut losses early if unconfident, protect gains when market move in your favour.
Not
dropping lower after retest trend line. could short now and stop at the trend line point if you don't mind the risk. otherwise wait for price to break 4443.Not
short the pullbackNot
Booooom. protect your gains and take partial profits if you followedNot
partial profit taken at 4340, stop to breakeven and let the rest run.Not
short would've entered at 4500 or 4443, let these run. can try long at current level for quick profit. stop at 4324Not
long would've played out well depend on how you entered and held. now there's opportunity to add short positions.Not
load up the bagNot
both trades stopped at breakeven if you entered as per above. price now in consolidate range.
Feragatname
Bilgiler ve yayınlar, TradingView tarafından sağlanan veya onaylanan finansal, yatırım, alım satım veya diğer türden tavsiye veya öneriler anlamına gelmez ve teşkil etmez. Kullanım Koşulları bölümünde daha fazlasını okuyun.
Feragatname
Bilgiler ve yayınlar, TradingView tarafından sağlanan veya onaylanan finansal, yatırım, alım satım veya diğer türden tavsiye veya öneriler anlamına gelmez ve teşkil etmez. Kullanım Koşulları bölümünde daha fazlasını okuyun.