
SPCX: Pure Price Action, Trading the Post-IPO Fibonacci Levels
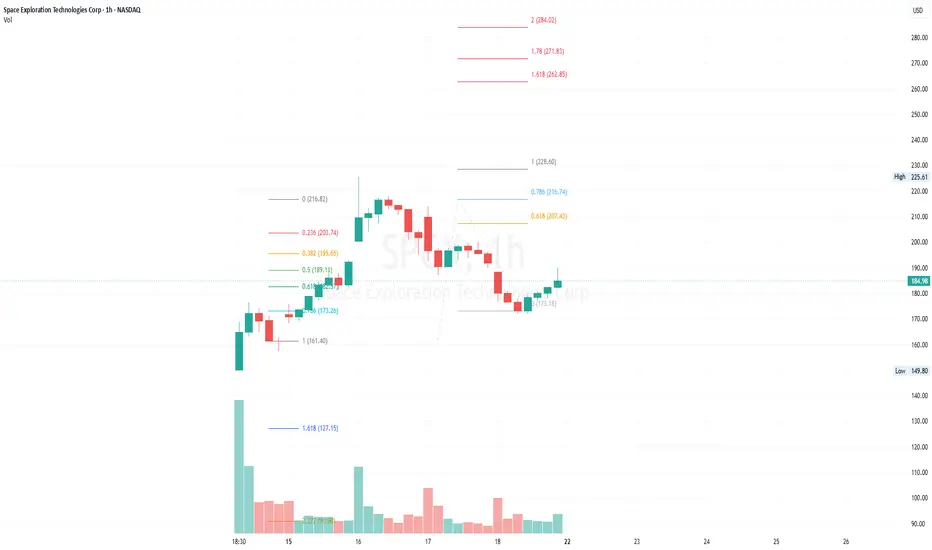
Following its massive initial public offering (IPO) last week, Space Exploration Technologies Corp is officially trading on the NASDAQ, presenting a fresh canvas for purely technical plays.
Keeping it completely simple and naked on the 1-hour chart. There is no need for overcomplicated indicators or complex theories when navigating a brand-new asset's early price discovery phase.
After hitting an early peak around the $225.61 level, the price experienced a natural post-IPO cooling-off period. It found temporary support right near the $173.18 level and is currently bouncing back up toward the $185.00 region.
What to Watch Next:
By plotting a simple Fibonacci retracement/extension tool on this lower timeframe, the immediate upside targets to keep an eye on are clearly mapped out at the $216.74 (0.786) and $228.60 (1.00) levels. Beyond that, a breakout opens the door to the extension targets sitting up at $262.85 (1.618) and $284.02 (2.00).
Educational Disclaimer: This chart is for educational purposes and purely based on technical analysis, not a buy/sell call. All entries, stop-loss setups, etc are entirely subject to your own risk evaluation. The author assumes no responsibility for market volatility or potential third-party manipulation/pump-and-dump. Always DYOR. Just an ordinary trader navigating the US, Qatar, and Malaysia stock markets.
Keeping it completely simple and naked on the 1-hour chart. There is no need for overcomplicated indicators or complex theories when navigating a brand-new asset's early price discovery phase.
After hitting an early peak around the $225.61 level, the price experienced a natural post-IPO cooling-off period. It found temporary support right near the $173.18 level and is currently bouncing back up toward the $185.00 region.
What to Watch Next:
By plotting a simple Fibonacci retracement/extension tool on this lower timeframe, the immediate upside targets to keep an eye on are clearly mapped out at the $216.74 (0.786) and $228.60 (1.00) levels. Beyond that, a breakout opens the door to the extension targets sitting up at $262.85 (1.618) and $284.02 (2.00).
Educational Disclaimer: This chart is for educational purposes and purely based on technical analysis, not a buy/sell call. All entries, stop-loss setups, etc are entirely subject to your own risk evaluation. The author assumes no responsibility for market volatility or potential third-party manipulation/pump-and-dump. Always DYOR. Just an ordinary trader navigating the US, Qatar, and Malaysia stock markets.

Feragatname
Bilgiler ve yayınlar, TradingView tarafından sağlanan veya onaylanan finansal, yatırım, alım satım veya diğer türden tavsiye veya öneriler anlamına gelmez ve teşkil etmez. Kullanım Koşulları bölümünde daha fazlasını okuyun.
Feragatname
Bilgiler ve yayınlar, TradingView tarafından sağlanan veya onaylanan finansal, yatırım, alım satım veya diğer türden tavsiye veya öneriler anlamına gelmez ve teşkil etmez. Kullanım Koşulları bölümünde daha fazlasını okuyun.