
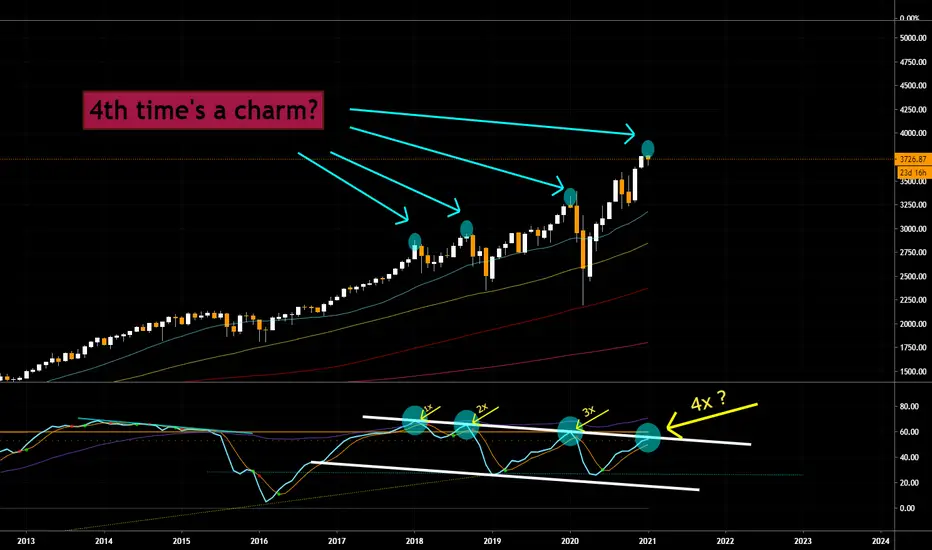
When in doubt, zoom out. Sometimes we miss the forest for the trees when we fail to take a step back. Open your mind to a broader range of data. There's simple math working behind every trend, of every candle, on every timeframe. Make a habit of studying those monthly candles every so often. It will allow you to see things you previously hadn't.
Take a look at the wavetrend indicator at the bottom and the three touches that have occurred:
1st - Jan 2018
2nd - Sept 2018
3rd - Jan 2020
4th - in process?
I believe this month (jan 21) and the next (Feb 21) are critical to this trend and whether or not we blow through into a parabolic rage or we have another correction. Take note, however of divergences on monthly timeframes by scrolling out and looking back at the tech bubble as well as 2014-2015. Bearish divergences are worth paying attention to but it does not mean that the market will respond in the way you think. There may be a loss of momentum but price can still creep up for months or years.
I tend to think we'll have some volatility this month as well as the next but I'm not so sure I'd call a top here. We can creep up for months or years or even blast upward into a hyper bubble. I have other tools and indicators I use to look for major tops but I'm not so sure that I see a major top yet.
Let me know your thoughts and where you think price is going!
Not
better shot of that lower indicator Not
Here are those other two examples of bearish divergences on monthly candles... be careful in thinking "oh, it's going to crash now". It's not impossible.. it just shows we have some math working in favor of a correction due to weakness and loss of momentum. I'll say though, the precision of the 4x touch of the one from 2018-2021 has some incredible precision so it'll be interesting to see what happens this month as well as the next.
Not
I'll share this chart from another idea I published not long ago. It's a shot of the dow jones on weekly candles. Take note of the bearish divergence being pressed RIGHT NOW. The price action of tomorrow & Friday are massively important. The close of this weekly candle will make or break this trend. Pivotal and decisive moment next few days! Not
Hmm, is this where we are? Not
we need to see a pivot now or there's something else at work here Not
as far as monthly candles go, it'll take the close of this month and the next to make it clear whether or not this trend is respected a 4th time. Not
I'm watching this upper line Not
Here's my custom indicator for viewing s&p stocks above their 200 and 50 day MA. This includes a set of averages that can be helpful in seeing the bigger picture.. I find that it requires me several minutes of staring at it to get anything useful out of it.. but it is certainly useful. Not
Nothing new.. same place. What's important, though, is this is the last week of the month. The close of this monthly candle should tell us an important story... market direction. It's a very important week and month. The little hiccup I observed today in market was interesting... Not
dow futures renko. Let's some some resistance. Come on. Not
textbook Not
Not
February..oh what will this month bring about? Watch this monthly candle-it's make or break time. There's a lot of time for a broad range Not
There are many similarities to the February 2020 monthly candle (green circle). I don't expect a repeat of what we saw a year ago although anything is possible. We're half way through this month so let's see what happens 
Feragatname
Bilgiler ve yayınlar, TradingView tarafından sağlanan veya onaylanan finansal, yatırım, alım satım veya diğer türden tavsiye veya öneriler anlamına gelmez ve teşkil etmez. Kullanım Koşulları bölümünde daha fazlasını okuyun.
Feragatname
Bilgiler ve yayınlar, TradingView tarafından sağlanan veya onaylanan finansal, yatırım, alım satım veya diğer türden tavsiye veya öneriler anlamına gelmez ve teşkil etmez. Kullanım Koşulları bölümünde daha fazlasını okuyun.