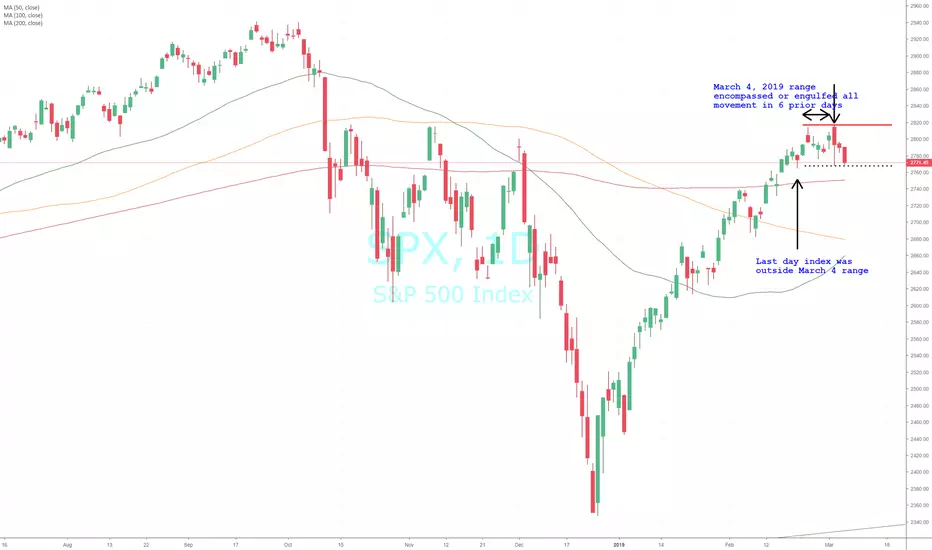
March 4, 2019 saw an engulfing pattern in the candlestick chart for the  S&P 500. Engulfing patterns are not rare, but one that engulfs the the price range for the prior 6 trading sessions is something to understand. I went back and found this same event (engulfing a minimum of 6 prior trading sessions) has occurred in the market only 15 times in the last 40 years. There are roughly 252 trading days in a year. Multiply that by 40 years and there have been roughly 10,080 trading days in the last 40 years. The event has occurred 0.149% over the studied time frame. This would qualify as very rare as defined by the i-base.info website.
Okay so this particular pattern is very rare, but why does it matter? Below are the charts for the most 10 most recent occurrences of this pattern. The critical information in these 10 prior instances are:
1. The index's direction prior to the pattern
2. The direction of the first break from the pattern's range
The full-analysis is available at my website. The next few days will dictate the accuracy of my analysis
July 2017

December 2013 and January 2014

April 2011

January 2005 - January 2007

January 2001

May 1997 -

May 1993 -

S&P 500. Engulfing patterns are not rare, but one that engulfs the the price range for the prior 6 trading sessions is something to understand. I went back and found this same event (engulfing a minimum of 6 prior trading sessions) has occurred in the market only 15 times in the last 40 years. There are roughly 252 trading days in a year. Multiply that by 40 years and there have been roughly 10,080 trading days in the last 40 years. The event has occurred 0.149% over the studied time frame. This would qualify as very rare as defined by the i-base.info website.Okay so this particular pattern is very rare, but why does it matter? Below are the charts for the most 10 most recent occurrences of this pattern. The critical information in these 10 prior instances are:
1. The index's direction prior to the pattern
2. The direction of the first break from the pattern's range
The full-analysis is available at my website. The next few days will dictate the accuracy of my analysis
July 2017
December 2013 and January 2014
April 2011
January 2005 - January 2007
January 2001
May 1997 -
May 1993 -
Not
The high from the March 4 pattern was finally broken to the downside. Looks like it will drop below 2770 in next few weeks if not sooner
All forecasts are based on analysis of past behavior. Prior movements are not always indicative of future movement. Develop the theory, test the theory. Do your own research. Nothing in this analysis constitutes advice. YouTube For More. Good luck!!
Feragatname
Bilgiler ve yayınlar, TradingView tarafından sağlanan veya onaylanan finansal, yatırım, alım satım veya diğer türden tavsiye veya öneriler anlamına gelmez ve teşkil etmez. Kullanım Koşulları bölümünde daha fazlasını okuyun.