
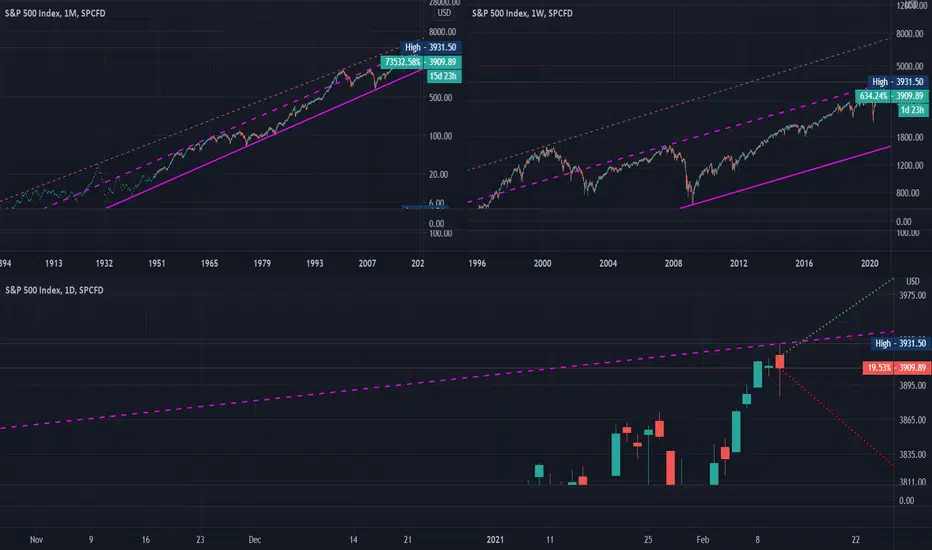
As you can see on these charts-the price is once again beating the channel resistance (purple dotted line). Perhaps the price will have to adjust to the level of $1950, equal to the Fibonacci correction of 0.618%. There is another more positive and desirable scenario for everyone - if there is very good news, the price will be able to gain a foothold above the purple line and go even higher-up to the pink dotted line.
Not
*logarithmic graph
Feragatname
Bilgiler ve yayınlar, TradingView tarafından sağlanan veya onaylanan finansal, yatırım, alım satım veya diğer türden tavsiye veya öneriler anlamına gelmez ve teşkil etmez. Kullanım Koşulları bölümünde daha fazlasını okuyun.
Feragatname
Bilgiler ve yayınlar, TradingView tarafından sağlanan veya onaylanan finansal, yatırım, alım satım veya diğer türden tavsiye veya öneriler anlamına gelmez ve teşkil etmez. Kullanım Koşulları bölümünde daha fazlasını okuyun.