
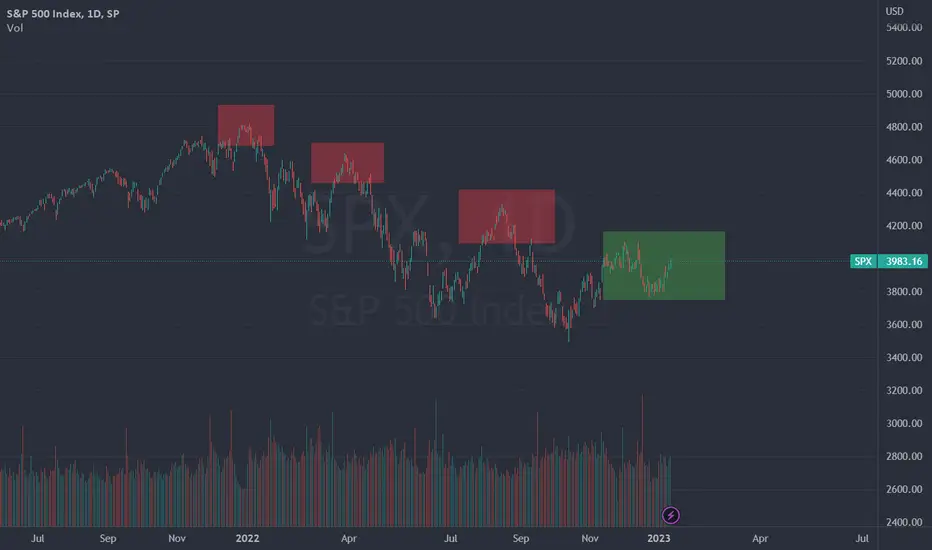
Quick post to those of you who've been following some of my ideas. I had previously drawn the similarity between now and 2008 in terms of chart patterns, but what's playing out seems to be much more like 1968 and 2001. Notice the double tops in green before the crash both had, which closely resembles what we're headed for now. These were also the starts of boom bust cycles happening in sets of 2. With this in mind, I'm adjusting to the 2001 timeline. My new PT is $265 which would hypothetically be at the end of August.


İlgili yayınlar
Feragatname
Bilgiler ve yayınlar, TradingView tarafından sağlanan veya onaylanan finansal, yatırım, alım satım veya diğer türden tavsiye veya öneriler anlamına gelmez ve teşkil etmez. Kullanım Koşulları bölümünde daha fazlasını okuyun.
İlgili yayınlar
Feragatname
Bilgiler ve yayınlar, TradingView tarafından sağlanan veya onaylanan finansal, yatırım, alım satım veya diğer türden tavsiye veya öneriler anlamına gelmez ve teşkil etmez. Kullanım Koşulları bölümünde daha fazlasını okuyun.