
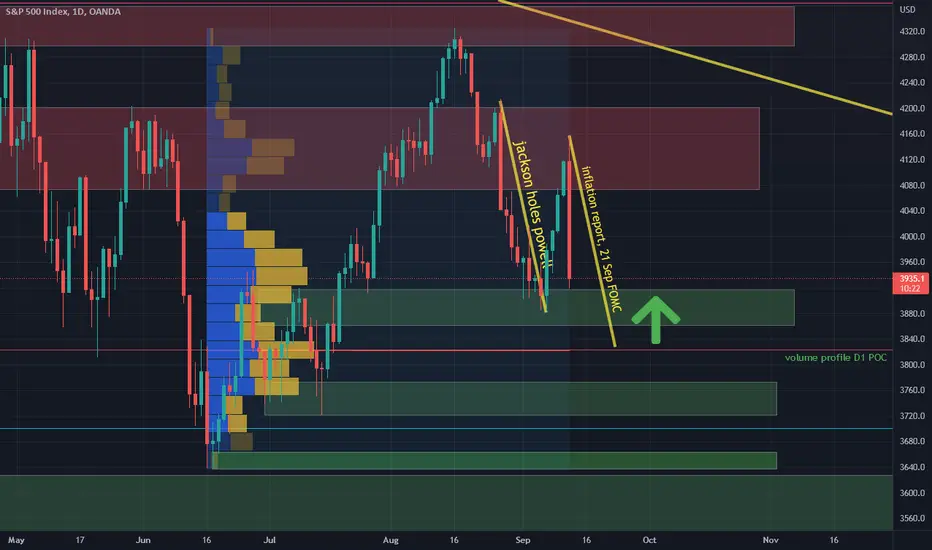
First down trend ( jackson holes ), now secound down trend (inflation and after that 21 sep FOMC). Will be secound down trend same strong as first?
Yellow line corresponds with point of control by volume profile. It will be very strong support zone for buy signal.
Yellow line corresponds with point of control by volume profile. It will be very strong support zone for buy signal.

Feragatname
Bilgiler ve yayınlar, TradingView tarafından sağlanan veya onaylanan finansal, yatırım, alım satım veya diğer türden tavsiye veya öneriler anlamına gelmez ve teşkil etmez. Kullanım Koşulları bölümünde daha fazlasını okuyun.
Feragatname
Bilgiler ve yayınlar, TradingView tarafından sağlanan veya onaylanan finansal, yatırım, alım satım veya diğer türden tavsiye veya öneriler anlamına gelmez ve teşkil etmez. Kullanım Koşulları bölümünde daha fazlasını okuyun.