
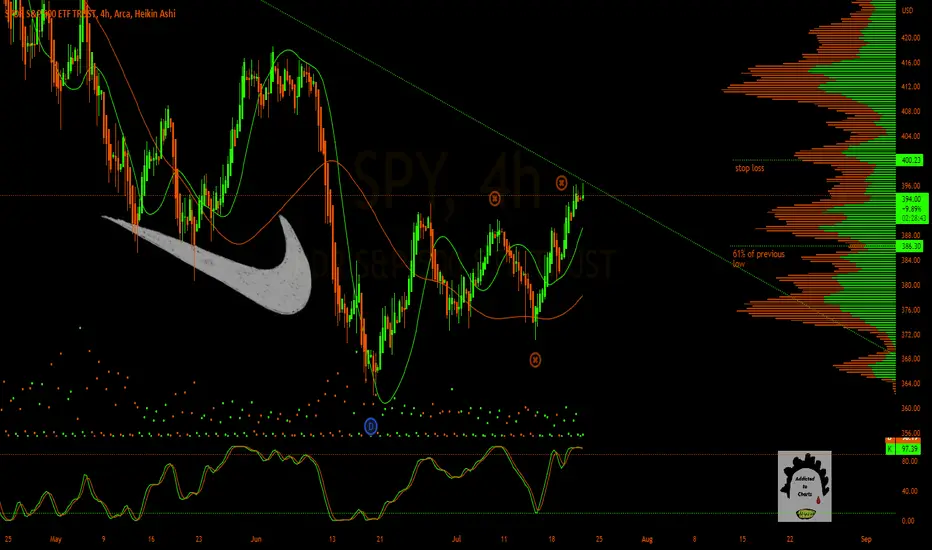
Looks like we may be at a pivot point. We are at an overbought area on the RSI. I believe that this may be an "abc" corrective wave pattern. We may be coming off of the C part of the wave. I didnt want to over mark the chart. Looking for a 61% Fibonacci retracement to the previous low. It's a fair fight around this area regarding bulls and bears volume so I recommend looking at volume analysis before we really see where price may go. Price may need to test this 200 HMA. However, I have my reasons to believe that this current rally needs a cooling down.
What do you think?
What do you think?

Feragatname
Bilgiler ve yayınlar, TradingView tarafından sağlanan veya onaylanan finansal, yatırım, alım satım veya diğer türden tavsiye veya öneriler anlamına gelmez ve teşkil etmez. Kullanım Koşulları bölümünde daha fazlasını okuyun.
Feragatname
Bilgiler ve yayınlar, TradingView tarafından sağlanan veya onaylanan finansal, yatırım, alım satım veya diğer türden tavsiye veya öneriler anlamına gelmez ve teşkil etmez. Kullanım Koşulları bölümünde daha fazlasını okuyun.