
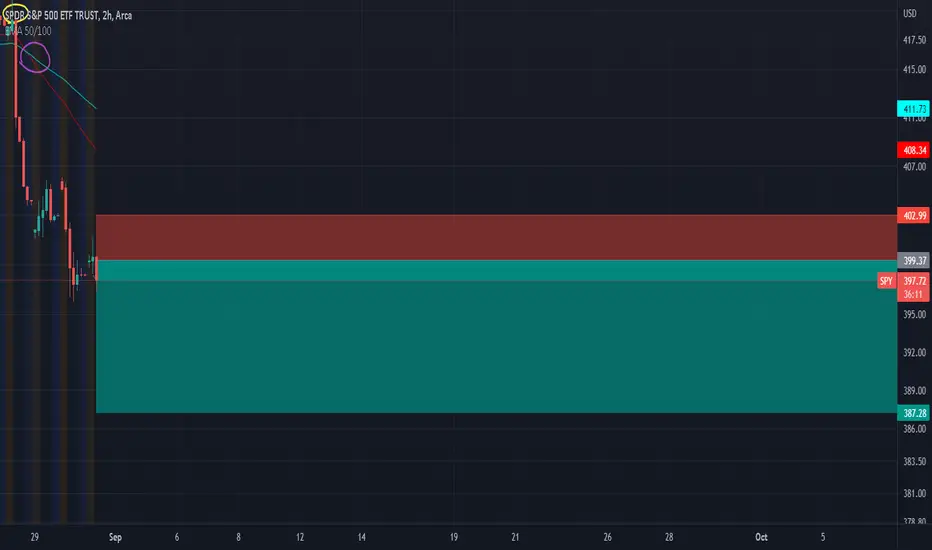
When looking at SPDR S&P 500 ETF’s current underlying value and most recent price behaviour when using a 2-hour range, investors can see that a three-bar pattern is made up of a Doji and an Engulfing candle. In this instance, the Doji’s suggest a sideways correction whilst the Engulfing red candle suggests continuation of the bareish momentum.
When observing 50 and 100 day ranged EMA averages investors can see that on the 26/08/22 shorter 50-day EMA moving average crossed beneath the longer 100-day EMA moving average. This dead cross was followed by a strong down trend, underlying prices falling 5%. This was after bullish rallies that were witnessed since mid-July. On 19/07/22 shorter 50-day EMA moving average crossed above longer 100-day EMA moving average. This fresh bullish crossover was followed by a rally that saw the underlying share value increase over 15%. Currently EMA moving average lines are not moving back towards one another, instead they are moving parallel in a different trajectory. Therefore, the down trend is more likely to strengthen before corrections occur.
Based on EMA moving averages and candlestick patterns and behaviour we are bareish in sentiment. We anticipate that the stock will fall further and have taken a short position as a result.
When observing 50 and 100 day ranged EMA averages investors can see that on the 26/08/22 shorter 50-day EMA moving average crossed beneath the longer 100-day EMA moving average. This dead cross was followed by a strong down trend, underlying prices falling 5%. This was after bullish rallies that were witnessed since mid-July. On 19/07/22 shorter 50-day EMA moving average crossed above longer 100-day EMA moving average. This fresh bullish crossover was followed by a rally that saw the underlying share value increase over 15%. Currently EMA moving average lines are not moving back towards one another, instead they are moving parallel in a different trajectory. Therefore, the down trend is more likely to strengthen before corrections occur.
Based on EMA moving averages and candlestick patterns and behaviour we are bareish in sentiment. We anticipate that the stock will fall further and have taken a short position as a result.

💥 Free signals and ideas ➡ t.me/vfinvestment
Feragatname
Bilgiler ve yayınlar, TradingView tarafından sağlanan veya onaylanan finansal, yatırım, alım satım veya diğer türden tavsiye veya öneriler anlamına gelmez ve teşkil etmez. Kullanım Koşulları bölümünde daha fazlasını okuyun.
💥 Free signals and ideas ➡ t.me/vfinvestment
Feragatname
Bilgiler ve yayınlar, TradingView tarafından sağlanan veya onaylanan finansal, yatırım, alım satım veya diğer türden tavsiye veya öneriler anlamına gelmez ve teşkil etmez. Kullanım Koşulları bölümünde daha fazlasını okuyun.