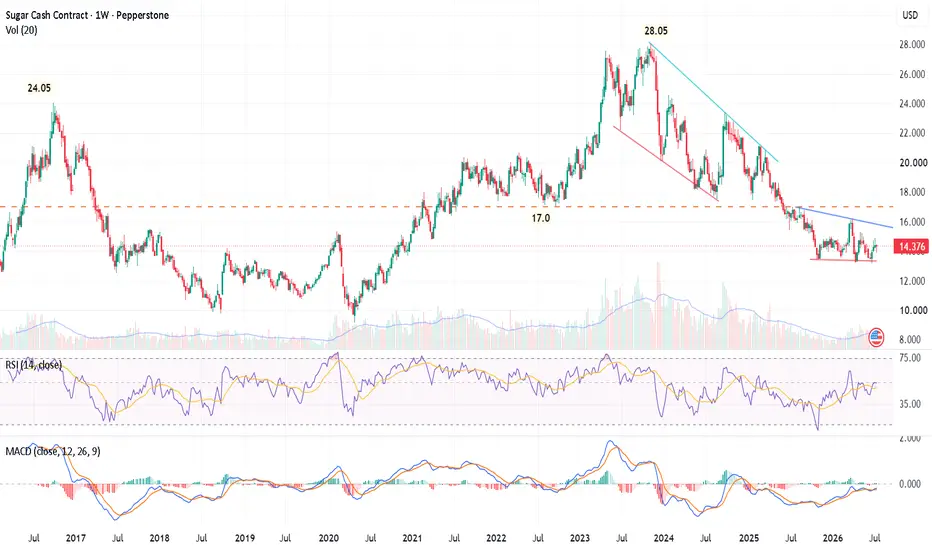
 SUGAR Weekly Chart
Key Support Test & Multi-Year Falling Wedge
Sugar (Cash / Spot) is currently trading around 14.37, undergoing a macro corrective phase after peaking at its 2023 major high of 28.05. A clear structure is forming on the weekly chart that sets up a potential high-probability setup for swing traders.
Technical Breakdown & Structure
Macro Geometry & Wedge Structure:
From the 28.05 peak down to the recent lows, price action is bounded within a descending structure (falling wedge/descending channel). Notice the highlighted blue resistance line above and the underlying red trendline support. Price is compressing toward the apex of this falling structure.
Horizontal Support Zone (13.90 – 14.30):
The current price level (14.376) is testing a critical horizontal support base (red baseline). On the weekly chart, this zone has consistently acted as a launchpad and structural pivot in previous cycles. A sustained break below 13.90 would invalidate the immediate bullish setup.
Key Macro Resistance Overhead (17.00):
The horizontal dashed orange level at 17.00 marks the major breakdown point from earlier in the cycle. This remains the primary macro hurdle for bulls in any upcoming relief rally.
Indicator Analysis
RSI (14): Currently sitting at 49.72 (Signal line at 45.86). The index has recovered from oversold conditions and is consolidating near the neutral 50 level, showing early signs of bullish divergence on lower timeframes relative to the recent price test of the 13.90 support area.
MACD (12, 26, 9): The MACD histogram has crossed back above zero, with the MACD line (0.054) crossing over the signal line (-0.182). While values remain near the zero line, this bullish crossover indicates momentum is gradually shifting back to the upside.
Trading Plan & Expectations
Scenario A: Bullish Reversal / Falling Wedge Breakout (Primary Bias)
Entry Trigger: A confirmed weekly close back above the immediate falling blue resistance trendline (~15.20 - 15.50).
Target 1: 17.00 (Major horizontal resistance pivot).
Target 2: 19.50 – 20.00 (Descending channel upper boundary / previous lower high).
Stop Loss: Below the key structural horizontal support at 13.80.
Scenario B: Bearish Breakdown (Invalidation)
If price fails to hold the 13.90 base and closes lower on the weekly timeframe, expect further downside toward the 12.50 – 12.00 psychological demand zone before any meaningful recovery.
Summary: Sugar is consolidating at a major multi-year support floor inside a long-term falling structure. Risk-to-reward strongly favors buyers near this 13.90 - 14.30 zone, provided risk is tightly managed below key support. A breakout above 15.50 will confirm a trend reversal toward 17.00+.

Feragatname
Bilgiler ve yayınlar, TradingView tarafından sağlanan veya onaylanan finansal, yatırım, alım satım veya diğer türden tavsiye veya öneriler anlamına gelmez ve teşkil etmez. Kullanım Koşulları bölümünde daha fazlasını okuyun.
Feragatname
Bilgiler ve yayınlar, TradingView tarafından sağlanan veya onaylanan finansal, yatırım, alım satım veya diğer türden tavsiye veya öneriler anlamına gelmez ve teşkil etmez. Kullanım Koşulları bölümünde daha fazlasını okuyun.