
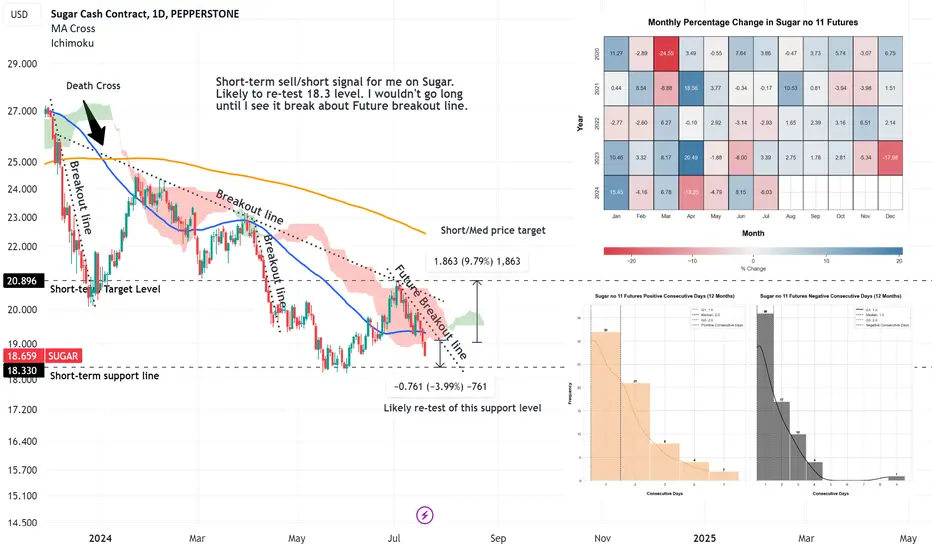
Short-term analysis of Sugar no11. Including 2 statistical charts showing the % monthly price changes over the last 5 years and a chart detailing the occurrence of consecutive positive and negative days "candles" and their frequency over 12 months.
- I expect more selling in July and then a rebound in August.
- Follow me on my socials for more detailed content
- I expect more selling in July and then a rebound in August.
- Follow me on my socials for more detailed content

Feragatname
Bilgiler ve yayınlar, TradingView tarafından sağlanan veya onaylanan finansal, yatırım, alım satım veya diğer türden tavsiye veya öneriler anlamına gelmez ve teşkil etmez. Kullanım Koşulları bölümünde daha fazlasını okuyun.
Feragatname
Bilgiler ve yayınlar, TradingView tarafından sağlanan veya onaylanan finansal, yatırım, alım satım veya diğer türden tavsiye veya öneriler anlamına gelmez ve teşkil etmez. Kullanım Koşulları bölümünde daha fazlasını okuyun.