
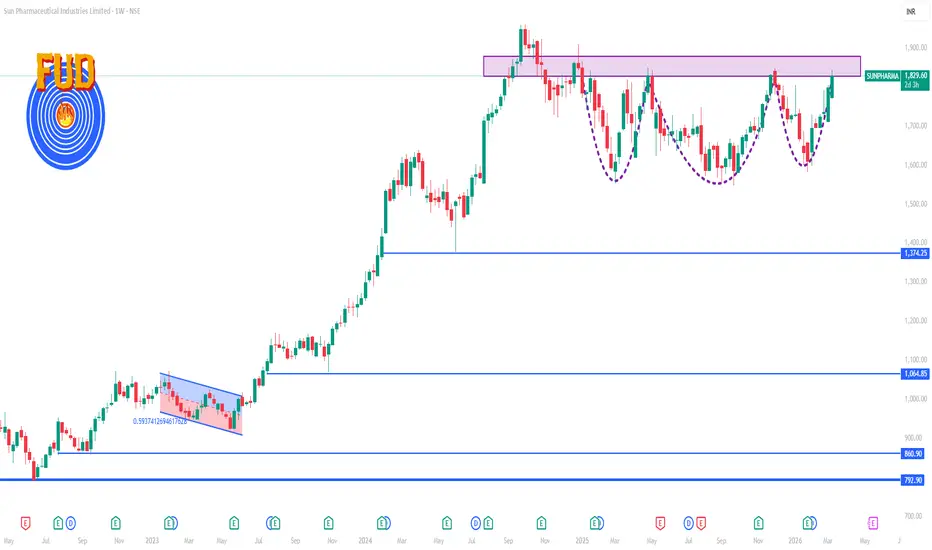
📍 Current Price (LIVE)
As of the latest market session (11 Mar 2026):
₹1,820 – ₹1,833 range — stock is trading near recent highs and close to its 52‑week high (~₹1,850).
This is your current base price for calculating weekly levels.
📈 1‑Week Key Levels (Approximate, Short‑Term Trading Focus)
🔹 Resistance Levels (Upside)
These mark potential zones where buyers may slow down or sellers could step in:
R1 (Immediate): ~₹1,840 – ₹1,845
R2: ~₹1,850 – ₹1,855 (near recent 52‑week high)
R3 (Bullish Breakout area): ~₹1,870+
A sustained breakout above ₹1,850–₹1,855 with volume could signal continuation uptrend.
🔻 Support Levels (Downside)
These are zones where the price may find buying interest / pullback support:
S1 (First): ~₹1,800 – ₹1,805
S2: ~₹1,780 – ₹1,785
S3 (Stronger): ~₹1,750 – ₹1,760
If price breaks below ₹1,780 this week, watch for deeper pullbacks toward ₹1,750.
🧠 Short‑Term Technical Reminder
The stock remains near the upper end of its recent trading range — above key shorter moving averages (20‑, 50‑DMA mostly bullish).
RSI/oscillators on short frames may show mild overbought if price stays near ₹1,850.
Breakout above weekly resistance (₹1,850+) could lead to short covering/range expansion.
📊 How to Use These Levels This Week
✅ Bullish bias: Price holding >₹1,800 with a break above ₹1,840 — next upside target ~₹1,850–₹1,870.
⚠️ Bearish bias (correction): Close below ₹1,780 — watch support near ₹1,750.
➡️ In‑between consolidation: Range ~₹1,780–₹1,840.

Contact Knowledgehub for a detailed consultation: Dm on WhatsApp: [wa.link/a2o0kz]-
Phone No: [+91 93102 26243]-
Email: [tradingviewknowledgehub@gmail.com]---
-- Let’s achieve success together!
Phone No: [+91 93102 26243]-
Email: [tradingviewknowledgehub@gmail.com]---
-- Let’s achieve success together!
İlgili yayınlar
Feragatname
Bilgiler ve yayınlar, TradingView tarafından sağlanan veya onaylanan finansal, yatırım, alım satım veya diğer türden tavsiye veya öneriler anlamına gelmez ve teşkil etmez. Kullanım Koşulları bölümünde daha fazlasını okuyun.