
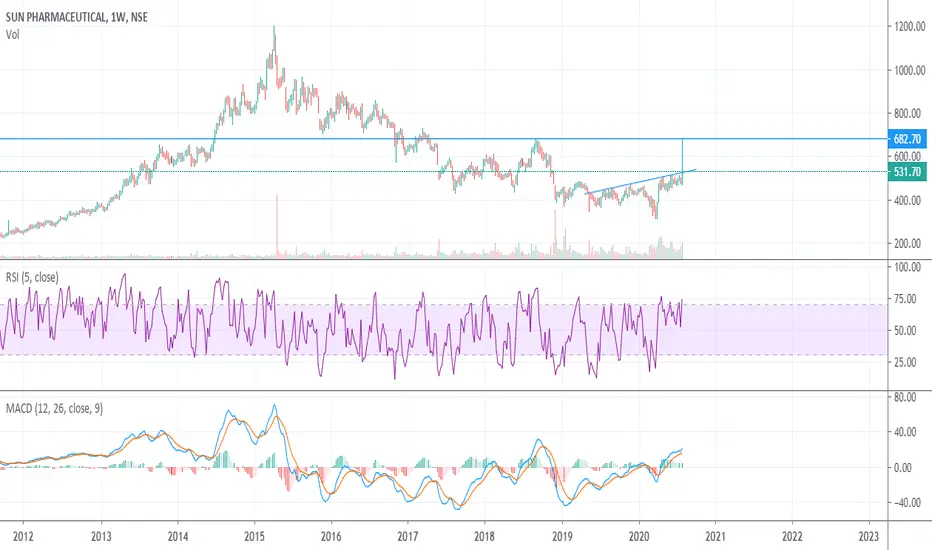
Well, atleast the charts say so.The stock on the weekly horizon is making an Inverted Head and Shoulders, the target for which comes to be about 680 odd levels. On the daily horizon, the stock is well above the key EMAs. Besides, the price shows no divergence with respect to the RSI and Stochastics.
This post is solely for education purpose.
This post is solely for education purpose.

Feragatname
Bilgiler ve yayınlar, TradingView tarafından sağlanan veya onaylanan finansal, yatırım, alım satım veya diğer türden tavsiye veya öneriler anlamına gelmez ve teşkil etmez. Kullanım Koşulları bölümünde daha fazlasını okuyun.
Feragatname
Bilgiler ve yayınlar, TradingView tarafından sağlanan veya onaylanan finansal, yatırım, alım satım veya diğer türden tavsiye veya öneriler anlamına gelmez ve teşkil etmez. Kullanım Koşulları bölümünde daha fazlasını okuyun.