
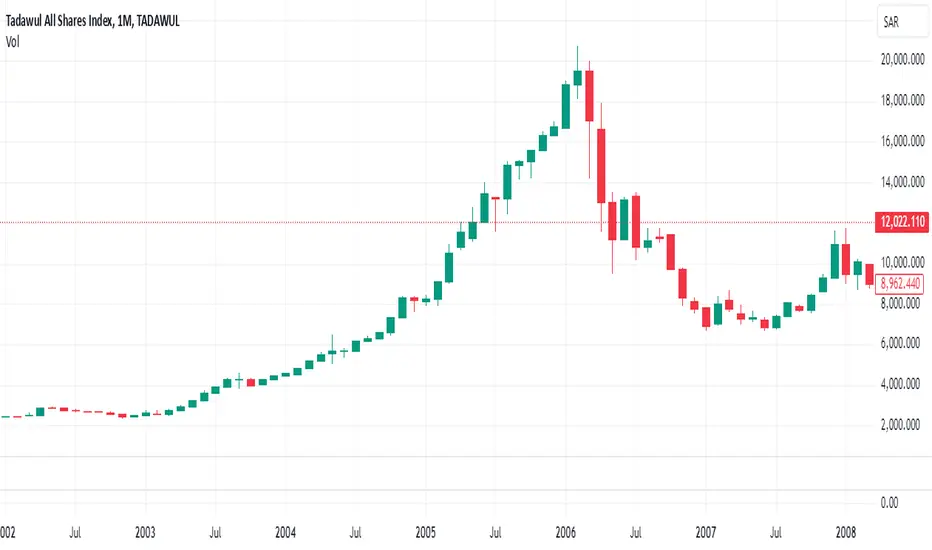
Historical data analysis of TASI, since its beginning in 1985, shows a peculiar pattern wherein trading TASI for only 6 months in a year for 10 consecutive years yields higher or similar returns compared to buy & hold strategy during the same period.
So a profitable strategic trading plan can be made with following
Key highlights:
If you like to access the trading plan in full details (with back testing proof in pdf & excel workbook), please reach out to me at: umairx88@gmail.com. Bear in mind that the month of November is not only included in the plan rather it is one of the crucial months of the plan.
So a profitable strategic trading plan can be made with following
Key highlights:
If you like to access the trading plan in full details (with back testing proof in pdf & excel workbook), please reach out to me at: umairx88@gmail.com. Bear in mind that the month of November is not only included in the plan rather it is one of the crucial months of the plan.

İlgili yayınlar
Feragatname
Bilgiler ve yayınlar, TradingView tarafından sağlanan veya onaylanan finansal, yatırım, alım satım veya diğer türden tavsiye veya öneriler anlamına gelmez ve teşkil etmez. Kullanım Koşulları bölümünde daha fazlasını okuyun.
İlgili yayınlar
Feragatname
Bilgiler ve yayınlar, TradingView tarafından sağlanan veya onaylanan finansal, yatırım, alım satım veya diğer türden tavsiye veya öneriler anlamına gelmez ve teşkil etmez. Kullanım Koşulları bölümünde daha fazlasını okuyun.