
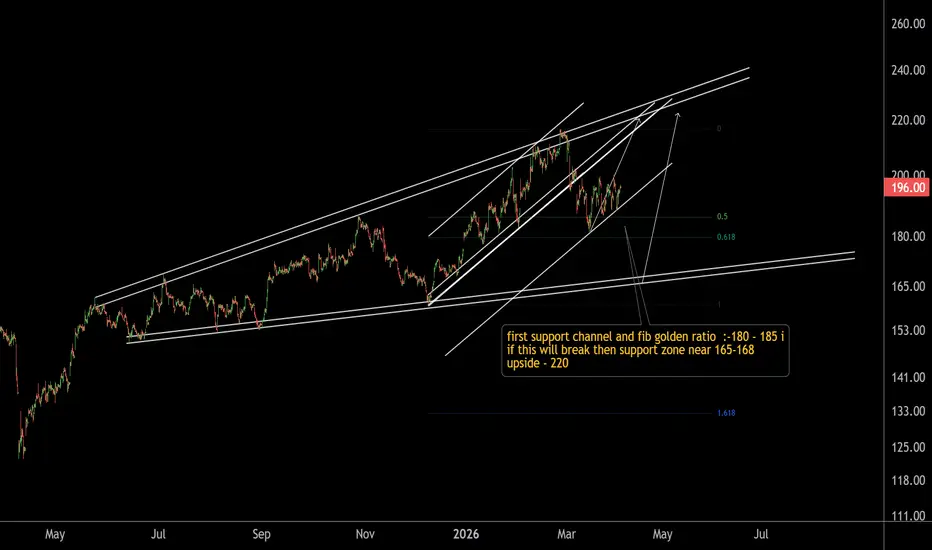
This is the 1-hour timeframe chart of Tata Steel.
The stock is showing a strong support zone based on two factors:
A short-term channel support
Fibonacci retracement support near the 180–185 zone
If the stock breaks below this level, the next support lies in the 165–168 range.
However, if the support zone sustains, we can expect an upside move towards 220–240.
Thank you.
The stock is showing a strong support zone based on two factors:
A short-term channel support
Fibonacci retracement support near the 180–185 zone
If the stock breaks below this level, the next support lies in the 165–168 range.
However, if the support zone sustains, we can expect an upside move towards 220–240.
Thank you.

@RahulSarawagi
Connect us at optionlab.co.in/
Connect us at optionlab.co.in/
Feragatname
Bilgiler ve yayınlar, TradingView tarafından sağlanan veya onaylanan finansal, yatırım, alım satım veya diğer türden tavsiye veya öneriler anlamına gelmez ve teşkil etmez. Kullanım Koşulları bölümünde daha fazlasını okuyun.
@RahulSarawagi
Connect us at optionlab.co.in/
Connect us at optionlab.co.in/
Feragatname
Bilgiler ve yayınlar, TradingView tarafından sağlanan veya onaylanan finansal, yatırım, alım satım veya diğer türden tavsiye veya öneriler anlamına gelmez ve teşkil etmez. Kullanım Koşulları bölümünde daha fazlasını okuyun.