
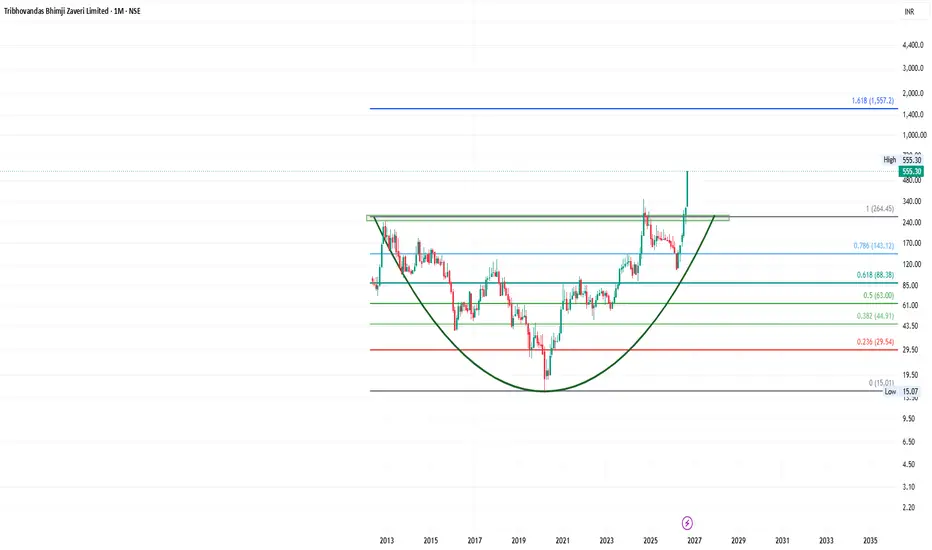
TBZ exhibits a multi-year Rounding Bottom / Cup Pattern Breakout on the monthly chart, having decisively crossed its decade-long neckline at ₹264.45. Based on structural wave expansion and Fibonacci projections, the stock holds technical potential to move ~50% higher from current market levels (~₹555) toward ₹830 – ₹835 over a 6 to 12-month horizon.
Key Technical Drivers
• Decadal Base Breakout: The monthly timeframe reveals a massive rounding bottom accumulation pattern spanning over 10 years (2014–2024), shifting the stock from a long-term bottoming structure into a hyper-bullish discovery phase.
• Volume Expansion & Momentum: The breakout above ₹264 was accompanied by massive trading volume expansion, confirming institutional absorption and trend validation.
• Fibonacci Target Trajectory:
o Pattern Neckline (1.0 Fib): ₹264.45
o Current Price (CMP): ~₹555.30
o First Upside Hurdle: ₹705.00
o 50% Target Zone (+50% from CMP): ₹830.00 – ₹835.00
o Extended Macro Target (1.618 Fib Extension): ₹1,557.20
Support Levels & Risk Management
• Immediate Support Zone: ₹480 – ₹500 (Previous local high acting as short-term floor).
• Major Structural Support: ₹360 – ₹430 (Key demand zone on any broader market consolidation).
• Invalidation Threshold: A monthly close below ₹308 invalidates the immediate continuation setup.
Trading & Investment Strategy
Positioning favors buying on dips toward the ₹480–₹510 zone rather than chasing vertical momentum at current highs. A trailing stop-loss below key support levels allows participation in the move toward the ₹830+ target while managing risk effectively.
Learn & Earn with Chartsboltahai. Happy Investing.

Feragatname
Bilgiler ve yayınlar, TradingView tarafından sağlanan veya onaylanan finansal, yatırım, alım satım veya diğer türden tavsiye veya öneriler anlamına gelmez ve teşkil etmez. Kullanım Koşulları bölümünde daha fazlasını okuyun.
Feragatname
Bilgiler ve yayınlar, TradingView tarafından sağlanan veya onaylanan finansal, yatırım, alım satım veya diğer türden tavsiye veya öneriler anlamına gelmez ve teşkil etmez. Kullanım Koşulları bölümünde daha fazlasını okuyun.