
Moving Averages: The Trader’s Guide to Trend, Momentum & Timing
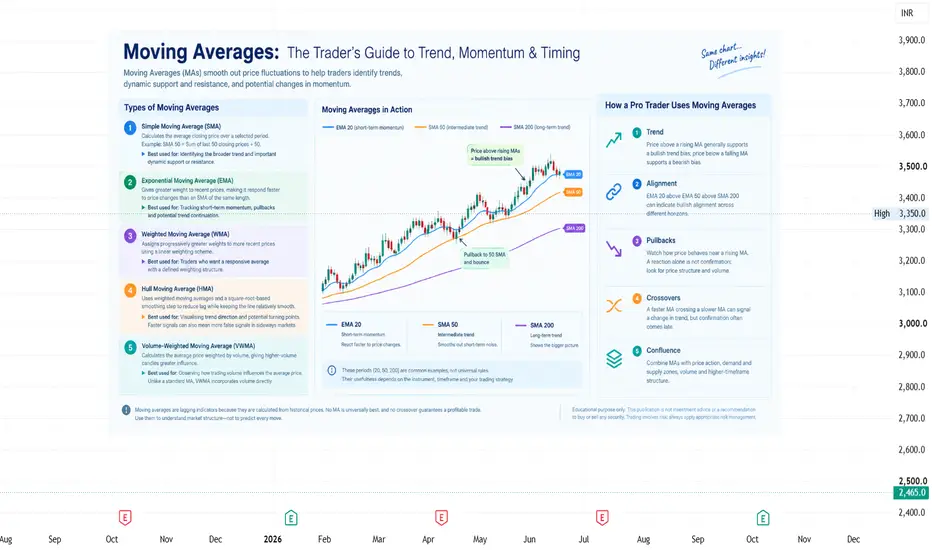
Moving Averages: The Trader’s Guide to Trend, Momentum & Timing
Moving Averages (MAs) smooth price fluctuations to help traders identify trends, dynamic support and resistance, and potential changes in momentum.
But not all moving averages work the same way. Understanding their differences helps you use them with purpose rather than adding more lines to your chart.
1. Simple Moving Average (SMA)
Calculates the average closing price over a selected period.
* Example: SMA 50 = Sum of the last 50 closing prices ÷ 50.
* Best used for: Identifying broader trends and dynamic support or resistance.
2. Exponential Moving Average (EMA)
Gives greater weight to recent prices, making it respond faster than an SMA of the same length.
* Best used for: Short-term momentum, pullbacks and potential trend continuation.
3. Weighted Moving Average (WMA)
Assigns progressively greater weights to recent prices using a linear weighting scheme.
* Best used for: Tracking price changes with greater responsiveness to recent data.
4. Hull Moving Average (HMA)
Uses weighted moving averages and a square-root-based smoothing step to reduce lag while maintaining smoothness.
* Best used for: Visualizing trend direction and potential turning points. Faster signals may produce more false signals in sideways markets.
5. Volume-Weighted Moving Average (VWMA)
Weights prices by their corresponding trading volumes, giving higher-volume candles greater influence.
* Best used for: Understanding how trading activity influences the average price.
How Can a Pro Trader Use Moving Averages?
Remember: Moving averages are lagging indicators because they use historical prices. No moving average is universally best, and no crossover guarantees a profitable trade.
Use them to understand market structure—not to predict every move.
Educational purpose only. This publication is not investment advice or a recommendation to buy or sell any security. Trading involves risk; always apply appropriate risk management.
Moving Averages (MAs) smooth price fluctuations to help traders identify trends, dynamic support and resistance, and potential changes in momentum.
But not all moving averages work the same way. Understanding their differences helps you use them with purpose rather than adding more lines to your chart.
1. Simple Moving Average (SMA)
Calculates the average closing price over a selected period.
* Example: SMA 50 = Sum of the last 50 closing prices ÷ 50.
* Best used for: Identifying broader trends and dynamic support or resistance.
2. Exponential Moving Average (EMA)
Gives greater weight to recent prices, making it respond faster than an SMA of the same length.
* Best used for: Short-term momentum, pullbacks and potential trend continuation.
3. Weighted Moving Average (WMA)
Assigns progressively greater weights to recent prices using a linear weighting scheme.
* Best used for: Tracking price changes with greater responsiveness to recent data.
4. Hull Moving Average (HMA)
Uses weighted moving averages and a square-root-based smoothing step to reduce lag while maintaining smoothness.
* Best used for: Visualizing trend direction and potential turning points. Faster signals may produce more false signals in sideways markets.
5. Volume-Weighted Moving Average (VWMA)
Weights prices by their corresponding trading volumes, giving higher-volume candles greater influence.
* Best used for: Understanding how trading activity influences the average price.
How Can a Pro Trader Use Moving Averages?
- Trend: Price above a rising MA generally supports a bullish bias; price below a falling MA supports a bearish bias.
- Alignment: EMA 20 above EMA 50 above SMA 200 can indicate bullish alignment across different time horizons.
- Pullbacks: Observe price behavior near a rising MA. Look for confirmation through price structure and volume.
- Crossovers: A faster MA crossing a slower MA may signal a trend change, but confirmation often comes late.
- Confluence: Combine MAs with price action, demand and supply zones, volume and higher-timeframe structure.
Remember: Moving averages are lagging indicators because they use historical prices. No moving average is universally best, and no crossover guarantees a profitable trade.
Use them to understand market structure—not to predict every move.
Educational purpose only. This publication is not investment advice or a recommendation to buy or sell any security. Trading involves risk; always apply appropriate risk management.

Feragatname
Bilgiler ve yayınlar, TradingView tarafından sağlanan veya onaylanan finansal, yatırım, alım satım veya diğer türden tavsiye veya öneriler anlamına gelmez ve teşkil etmez. Kullanım Koşulları bölümünde daha fazlasını okuyun.
Feragatname
Bilgiler ve yayınlar, TradingView tarafından sağlanan veya onaylanan finansal, yatırım, alım satım veya diğer türden tavsiye veya öneriler anlamına gelmez ve teşkil etmez. Kullanım Koşulları bölümünde daha fazlasını okuyun.