
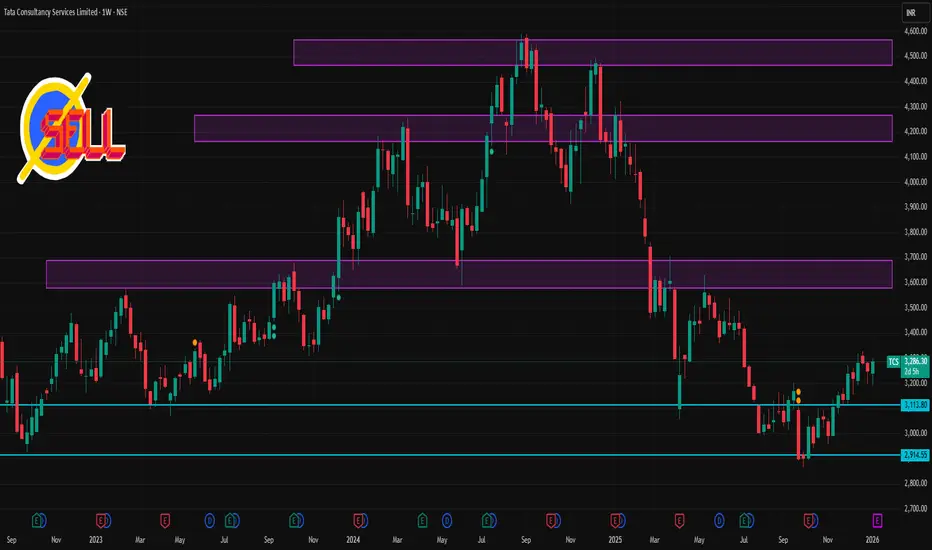
📊 Weekly Price Range & Levels
Current share price is trading around ₹3,250–₹3,280 (recent data).
Key Weekly Resistance
R3 / Upper resistance: ~₹3,382–3,383 (stronger barrier)
R2: ~₹3,335
R1: ~₹3,293–3,315 (first hurdle)
Interpretation:
If price breaks above ₹3,315–₹3,335, bulls may aim toward ₹3,380+ this week.
Key Weekly Support
S1: ~₹3,203–₹3,258 (primary support zone)
S2: ~₹3,155–₹3,236
S3: ~₹3,113–₹3,200 (deeper support)
Interpretation:
Holding above ₹3,200–₹3,203 is key for short‑term strength. A break below ₹3,155 could signal weakness and extend the slide.
🟡 Summary Weekly Levels
Level Price Zone (Approx)
Strong Resistance ₹3,350–₹3,382
First Resistance ₹3,293–₹3,315
Current Range ~₹3,250–₹3,280
Support 1 ₹3,203–₹3,258
Support 2 ₹3,155–₹3,236
Support 3 ₹3,113–₹3,200
✅ Trading takeaway:
Short‑term buyers may look for strength above ₹3,315–₹3,335 to target ₹3,380+.
On the downside, watch ₹3,200 — below that, deeper support zones near ₹3,155–₹3,113 come into play.

Contact Knowledgehub for a detailed consultation: Dm on WhatsApp: [wa.link/a2o0kz]-
Phone No: [+91 93102 26243]-
Email: [tradingviewknowledgehub@gmail.com]---
-- Let’s achieve success together!
Phone No: [+91 93102 26243]-
Email: [tradingviewknowledgehub@gmail.com]---
-- Let’s achieve success together!
İlgili yayınlar
Feragatname
Bilgiler ve yayınlar, TradingView tarafından sağlanan veya onaylanan finansal, yatırım, alım satım veya diğer türden tavsiye veya öneriler anlamına gelmez ve teşkil etmez. Kullanım Koşulları bölümünde daha fazlasını okuyun.