
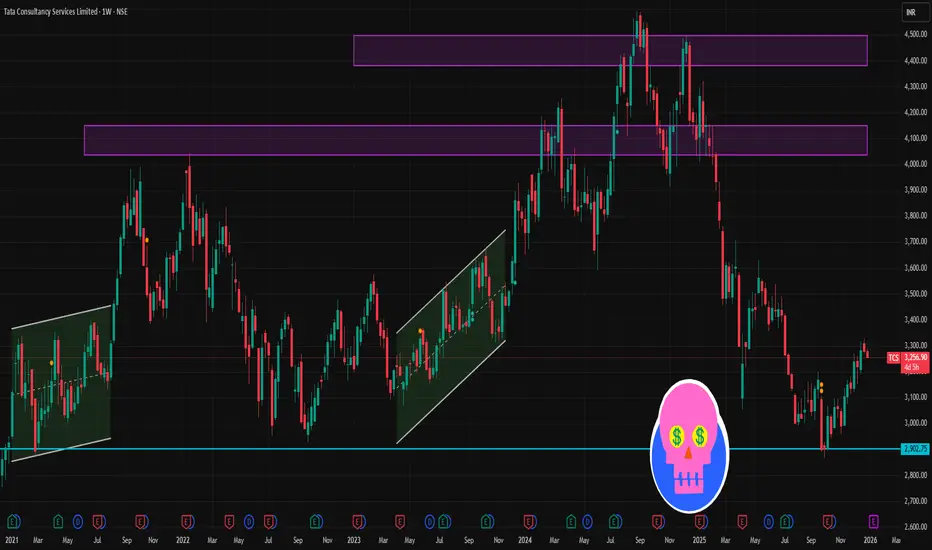
📊 Current Price Context
TCS is trading around ₹3,260–₹3,280 on NSE.
The stock continues to consolidate in a sideways range, showing mixed momentum.
🎯 Key Levels — 1‑Week View (Support & Resistance)
🟦 Support Zones
Immediate Support: ~₹3,258–₹3,260 (near current intraday lows) — break below here signals weakness.
Secondary Support: ~₹3,236–₹3,242 — if price closes below this, broader selling could accelerate.
🟥 Resistance Zones
Immediate Resistance: ~₹3,310–₹3,315 — this is the first supply area the market needs to clear.
Upside Breakout Target: ~₹3,350 — clearing and holding above this could shift the short‑term bias bullish.
📌 Summary of Levels
Level Type Price Zone Interpretation
Immediate Support ₹3,258–3,260 Short‑term bulls must hold
Secondary Support ₹3,236–3,242 Key breakdown trigger
Immediate Resistance ₹3,310–3,315 First upside hurdle
Breakout Resistance ₹3,350+ Bullish continuation zone
📌 Short‑Term Trader Notes
Use closing prices (not just intraday levels) to confirm breaks of support/resistance.
Watch for volume spikes near support or resistance to validate breakouts or breakdowns.
RSI and MACD remain useful to spot divergence signals (oversold/overbought).
TCS is trading around ₹3,260–₹3,280 on NSE.
The stock continues to consolidate in a sideways range, showing mixed momentum.
🎯 Key Levels — 1‑Week View (Support & Resistance)
🟦 Support Zones
Immediate Support: ~₹3,258–₹3,260 (near current intraday lows) — break below here signals weakness.
Secondary Support: ~₹3,236–₹3,242 — if price closes below this, broader selling could accelerate.
🟥 Resistance Zones
Immediate Resistance: ~₹3,310–₹3,315 — this is the first supply area the market needs to clear.
Upside Breakout Target: ~₹3,350 — clearing and holding above this could shift the short‑term bias bullish.
📌 Summary of Levels
Level Type Price Zone Interpretation
Immediate Support ₹3,258–3,260 Short‑term bulls must hold
Secondary Support ₹3,236–3,242 Key breakdown trigger
Immediate Resistance ₹3,310–3,315 First upside hurdle
Breakout Resistance ₹3,350+ Bullish continuation zone
📌 Short‑Term Trader Notes
Use closing prices (not just intraday levels) to confirm breaks of support/resistance.
Watch for volume spikes near support or resistance to validate breakouts or breakdowns.
RSI and MACD remain useful to spot divergence signals (oversold/overbought).

Contact Knowledgehub for a detailed consultation: Dm on WhatsApp: [wa.link/a2o0kz]-
Phone No: [+91 93102 26243]-
Email: [tradingviewknowledgehub@gmail.com]---
-- Let’s achieve success together!
Phone No: [+91 93102 26243]-
Email: [tradingviewknowledgehub@gmail.com]---
-- Let’s achieve success together!
İlgili yayınlar
Feragatname
Bilgiler ve yayınlar, TradingView tarafından sağlanan veya onaylanan finansal, yatırım, alım satım veya diğer türden tavsiye veya öneriler anlamına gelmez ve teşkil etmez. Kullanım Koşulları bölümünde daha fazlasını okuyun.
Contact Knowledgehub for a detailed consultation: Dm on WhatsApp: [wa.link/a2o0kz]-
Phone No: [+91 93102 26243]-
Email: [tradingviewknowledgehub@gmail.com]---
-- Let’s achieve success together!
Phone No: [+91 93102 26243]-
Email: [tradingviewknowledgehub@gmail.com]---
-- Let’s achieve success together!
İlgili yayınlar
Feragatname
Bilgiler ve yayınlar, TradingView tarafından sağlanan veya onaylanan finansal, yatırım, alım satım veya diğer türden tavsiye veya öneriler anlamına gelmez ve teşkil etmez. Kullanım Koşulları bölümünde daha fazlasını okuyun.