TCT falling wedge
#TCTBTC
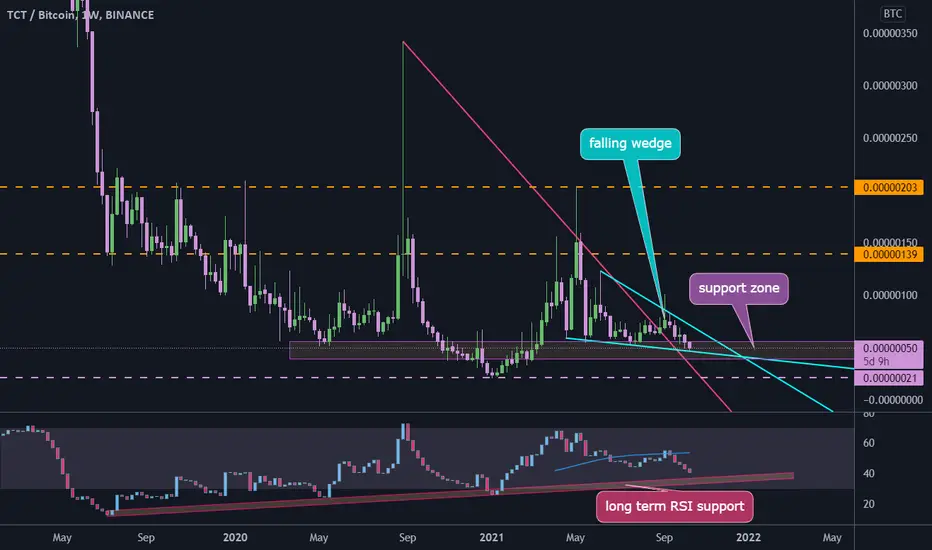
#TCT with BTC pair shows a falling wedge pattern in daily time frame, we can see that price broke out from descending resistance line and going down near this line, there is a long term support zone in RSI that shows price may fall more to touch it one more time then head up and break the wedge pattern.
#TCT with BTC pair shows a falling wedge pattern in daily time frame, we can see that price broke out from descending resistance line and going down near this line, there is a long term support zone in RSI that shows price may fall more to touch it one more time then head up and break the wedge pattern.

Feragatname
Bilgiler ve yayınlar, TradingView tarafından sağlanan veya onaylanan finansal, yatırım, alım satım veya diğer türden tavsiye veya öneriler anlamına gelmez ve teşkil etmez. Kullanım Koşulları bölümünde daha fazlasını okuyun.
Feragatname
Bilgiler ve yayınlar, TradingView tarafından sağlanan veya onaylanan finansal, yatırım, alım satım veya diğer türden tavsiye veya öneriler anlamına gelmez ve teşkil etmez. Kullanım Koşulları bölümünde daha fazlasını okuyun.