
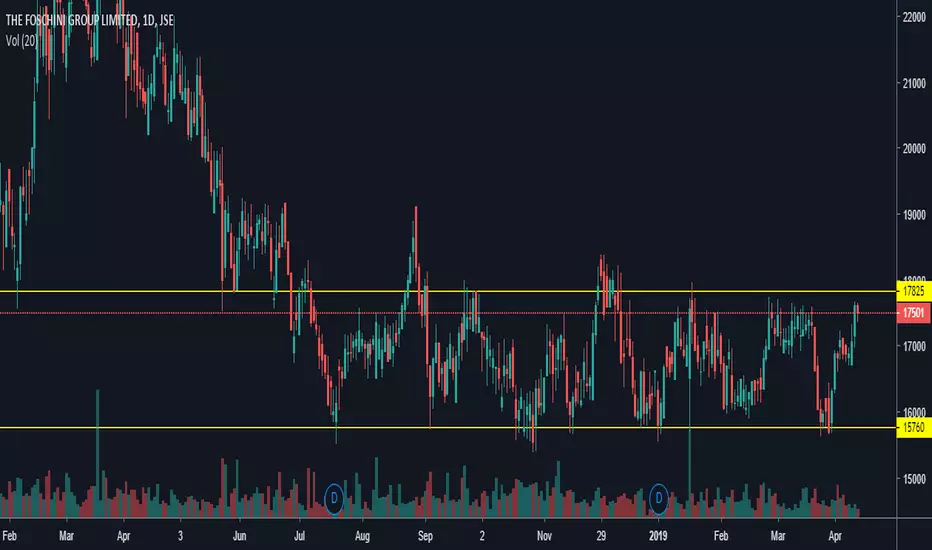
There is no magic crystal ball here. Whether you are on the daily timeframe or 4-hour, the stars are aligned baby! The price for this stock is moving in a clear range with the support at 15 760 and the resistance at 17 825. Now we can see a bearish candle start to form at the top, and a second closure of a bearish candle will likely be my trigger for the trade. A more conservative entry would be to enter when the third bearish candle moves halfway the length of the prior candle.

Feragatname
Bilgiler ve yayınlar, TradingView tarafından sağlanan veya onaylanan finansal, yatırım, alım satım veya diğer türden tavsiye veya öneriler anlamına gelmez ve teşkil etmez. Kullanım Koşulları bölümünde daha fazlasını okuyun.
Feragatname
Bilgiler ve yayınlar, TradingView tarafından sağlanan veya onaylanan finansal, yatırım, alım satım veya diğer türden tavsiye veya öneriler anlamına gelmez ve teşkil etmez. Kullanım Koşulları bölümünde daha fazlasını okuyun.