
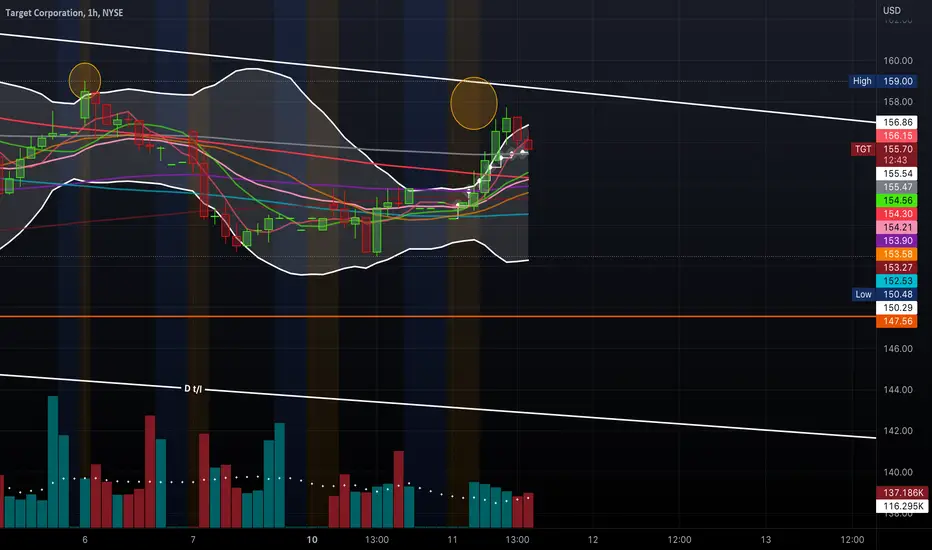
Target With A "Bullseye"?
I've identified a falling wedge pattern on Target's daily chart. Also, the RSI indicator shows higher highs and higher lows.
Short float % for TGT was at 2.02% at time of this post.
TGT is a good candidate for a swing. I have my "Bullseye" above 159 or at the break of the upper trendline.

*This is not financial advice.
I've identified a falling wedge pattern on Target's daily chart. Also, the RSI indicator shows higher highs and higher lows.
Short float % for TGT was at 2.02% at time of this post.
TGT is a good candidate for a swing. I have my "Bullseye" above 159 or at the break of the upper trendline.
*This is not financial advice.

Feragatname
Bilgiler ve yayınlar, TradingView tarafından sağlanan veya onaylanan finansal, yatırım, alım satım veya diğer türden tavsiye veya öneriler anlamına gelmez ve teşkil etmez. Kullanım Koşulları bölümünde daha fazlasını okuyun.
Feragatname
Bilgiler ve yayınlar, TradingView tarafından sağlanan veya onaylanan finansal, yatırım, alım satım veya diğer türden tavsiye veya öneriler anlamına gelmez ve teşkil etmez. Kullanım Koşulları bölümünde daha fazlasını okuyun.