
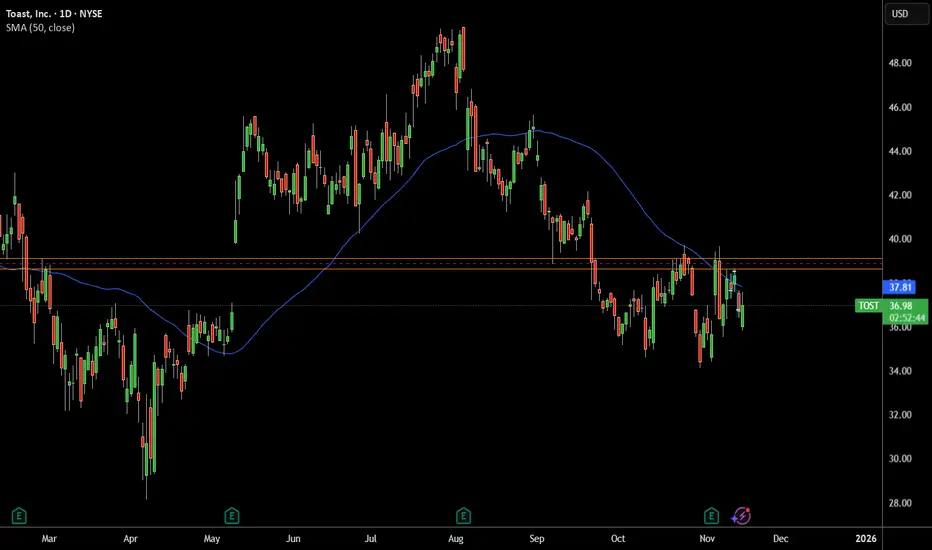
Price Rejected From Major Resistance
The stock is sitting right below a heavy resistance zone around $38–40, which has rejected price multiple times in the past.
Every time TOST comes near this zone, sellers step in → clear bearish supply area.
2. Below the 50-Day Moving Average
Price is trading under the 50 SMA (blue line).
In downtrending or weak stocks, the 50 SMA acts as dynamic resistance, pushing price lower.
3. Lower Highs Formation
The recent bounce failed to create a higher high.
Instead, TOST is forming lower highs, which is a classic bearish continuation signal.
4. Failed Breakout Attempt
TOST tried to break above the resistance but got instantly sold off.
This is a sign of weak buying demand and strong sellers.
The stock is sitting right below a heavy resistance zone around $38–40, which has rejected price multiple times in the past.
Every time TOST comes near this zone, sellers step in → clear bearish supply area.
2. Below the 50-Day Moving Average
Price is trading under the 50 SMA (blue line).
In downtrending or weak stocks, the 50 SMA acts as dynamic resistance, pushing price lower.
3. Lower Highs Formation
The recent bounce failed to create a higher high.
Instead, TOST is forming lower highs, which is a classic bearish continuation signal.
4. Failed Breakout Attempt
TOST tried to break above the resistance but got instantly sold off.
This is a sign of weak buying demand and strong sellers.
İşlem kapandı: hedefe ulaştı

Feragatname
Bilgiler ve yayınlar, TradingView tarafından sağlanan veya onaylanan finansal, yatırım, alım satım veya diğer türden tavsiye veya öneriler anlamına gelmez ve teşkil etmez. Kullanım Koşulları bölümünde daha fazlasını okuyun.
Feragatname
Bilgiler ve yayınlar, TradingView tarafından sağlanan veya onaylanan finansal, yatırım, alım satım veya diğer türden tavsiye veya öneriler anlamına gelmez ve teşkil etmez. Kullanım Koşulları bölümünde daha fazlasını okuyun.