

Right now TOTAL is showing early signs of a double top forming on the 4H timeframe.
The total crypto market cap reached $2.71T on May 6, 2026 when BTC hit a high of $82,800, then saw a secondary rejection from that same level on May 10, 2026 when BTC created a slightly lower high of $82,500.
Apart from the key levels I have been laying out for individual cryptocurrencies like BTC and ETH, why is this level so important for TOTAL? There are two very significant historical tests of this level that give it major relevance at the current moment.
Back in March 2024, TOTAL made a top at $2.72T. After that top was established, TOTAL lost over $1 trillion in value and dropped to a low of $1.69T in August 2024. Then most recently, in November 2025 after the bull market top was recorded at $4.27T, the entire market cap dropped to a low of $2.73T before the dead cat bounce began. From that $2.73T low the market cap added approximately $600 billion before forming a high at $3.29T and starting the next decline.
Therefore, with current price action developing around such a significant market cap level that has acted as two major pivot points over the past two years, this could very well end up being the next major pivot point before the next drop to the downside begins. It is too early to say with certainty as this is still in the process of developing, but it was important to get this outlined for you all.
On the lower timeframe, the support zone everyone should be watching is outlined in the green box. This zone acted as resistance many times (red arrows) and is currently acting as new support (green arrows). The most recent test of that support aligned perfectly with my BTC prediction of price retreating to $79,500 before bouncing, which can be found here:
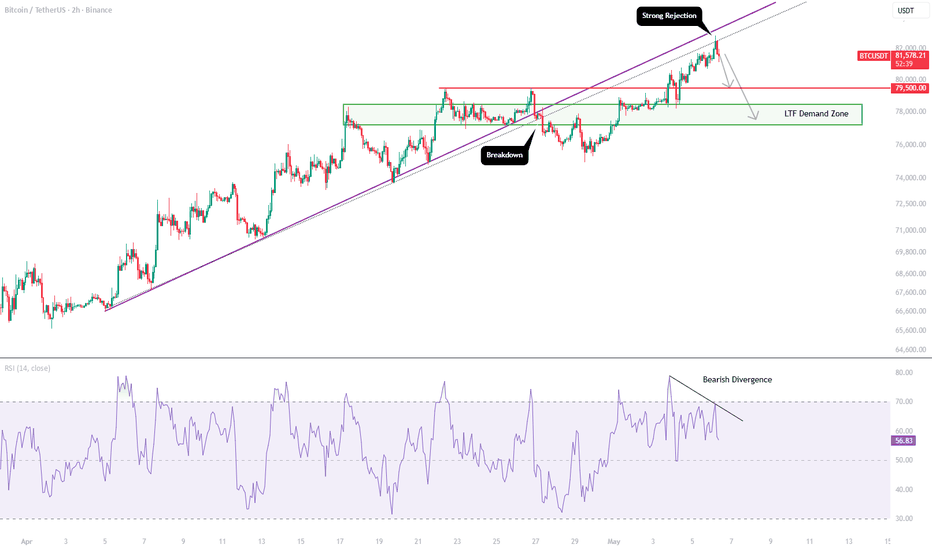
As long as that support zone holds, the market cap has a little more room to push slightly higher, which would most likely align with BTC moving toward $84,000 to $85,000.
However, if that lower timeframe support zone is lost it will most likely flip back into resistance and a decline toward $2.41T (the 0.618 Fibonacci) will begin. It is difficult to say exactly where that move would put Bitcoin, but it could range anywhere from $70,000 to $72,000.
It is also worth noting the 4H RSI has continued to top around the 74 level (red line).
The total crypto market cap reached $2.71T on May 6, 2026 when BTC hit a high of $82,800, then saw a secondary rejection from that same level on May 10, 2026 when BTC created a slightly lower high of $82,500.
Apart from the key levels I have been laying out for individual cryptocurrencies like BTC and ETH, why is this level so important for TOTAL? There are two very significant historical tests of this level that give it major relevance at the current moment.
Back in March 2024, TOTAL made a top at $2.72T. After that top was established, TOTAL lost over $1 trillion in value and dropped to a low of $1.69T in August 2024. Then most recently, in November 2025 after the bull market top was recorded at $4.27T, the entire market cap dropped to a low of $2.73T before the dead cat bounce began. From that $2.73T low the market cap added approximately $600 billion before forming a high at $3.29T and starting the next decline.
Therefore, with current price action developing around such a significant market cap level that has acted as two major pivot points over the past two years, this could very well end up being the next major pivot point before the next drop to the downside begins. It is too early to say with certainty as this is still in the process of developing, but it was important to get this outlined for you all.
On the lower timeframe, the support zone everyone should be watching is outlined in the green box. This zone acted as resistance many times (red arrows) and is currently acting as new support (green arrows). The most recent test of that support aligned perfectly with my BTC prediction of price retreating to $79,500 before bouncing, which can be found here:
As long as that support zone holds, the market cap has a little more room to push slightly higher, which would most likely align with BTC moving toward $84,000 to $85,000.
However, if that lower timeframe support zone is lost it will most likely flip back into resistance and a decline toward $2.41T (the 0.618 Fibonacci) will begin. It is difficult to say exactly where that move would put Bitcoin, but it could range anywhere from $70,000 to $72,000.
It is also worth noting the 4H RSI has continued to top around the 74 level (red line).

Feragatname
Bilgiler ve yayınlar, TradingView tarafından sağlanan veya onaylanan finansal, yatırım, alım satım veya diğer türden tavsiye veya öneriler anlamına gelmez ve teşkil etmez. Kullanım Koşulları bölümünde daha fazlasını okuyun.
Feragatname
Bilgiler ve yayınlar, TradingView tarafından sağlanan veya onaylanan finansal, yatırım, alım satım veya diğer türden tavsiye veya öneriler anlamına gelmez ve teşkil etmez. Kullanım Koşulları bölümünde daha fazlasını okuyun.