
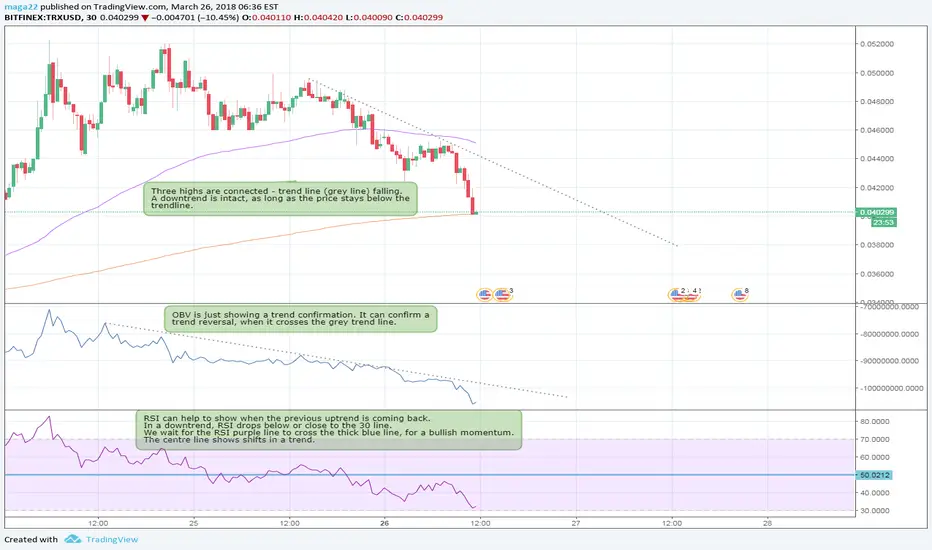
Everything confirms and shows a downtrend, but looking at the trendlines and centre line for the RSI indicator. It seems that we can perhaps hope for a reversal soon
IF
1.Candle stick crosses the grey dotted line and we see higher highs.
2.OBV line crosses grey dotted line and we see an increase
3.RSI crosses centre line (50) for a bullish momentum.
Do you agree with me? If not, please let me know how you would analyse it.
Thanks!
IF
1.Candle stick crosses the grey dotted line and we see higher highs.
2.OBV line crosses grey dotted line and we see an increase
3.RSI crosses centre line (50) for a bullish momentum.
Do you agree with me? If not, please let me know how you would analyse it.
Thanks!

Feragatname
Bilgiler ve yayınlar, TradingView tarafından sağlanan veya onaylanan finansal, yatırım, alım satım veya diğer türden tavsiye veya öneriler anlamına gelmez ve teşkil etmez. Kullanım Koşulları bölümünde daha fazlasını okuyun.
Feragatname
Bilgiler ve yayınlar, TradingView tarafından sağlanan veya onaylanan finansal, yatırım, alım satım veya diğer türden tavsiye veya öneriler anlamına gelmez ve teşkil etmez. Kullanım Koşulları bölümünde daha fazlasını okuyun.