
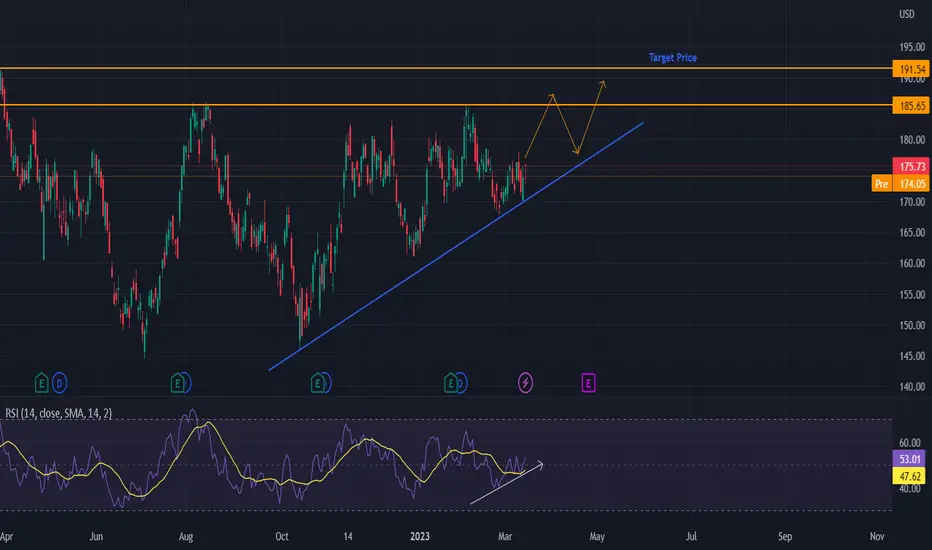
On the chart we can see that there are higher highs and higher lows. The RSI indicator crossing above the 50 mark and heading upward, indicates a bullish momentum. We expect that the price will reach the resistance. As it is a strong resistance, we anticipate the price to get rejected. Next, we expect another upsloping attempt towards the resistance level. Invalidation of this theses would be if the price closes below the upsloping trendline.
Not
The price got rejected from the resistance and found support on the upsloping rendline again. So far so good. The target price remains unchanged.
💥 Free signals and ideas ➡ t.me/vfinvestment
İlgili yayınlar
Feragatname
Bilgiler ve yayınlar, TradingView tarafından sağlanan veya onaylanan finansal, yatırım, alım satım veya diğer türden tavsiye veya öneriler anlamına gelmez ve teşkil etmez. Kullanım Koşulları bölümünde daha fazlasını okuyun.
💥 Free signals and ideas ➡ t.me/vfinvestment
İlgili yayınlar
Feragatname
Bilgiler ve yayınlar, TradingView tarafından sağlanan veya onaylanan finansal, yatırım, alım satım veya diğer türden tavsiye veya öneriler anlamına gelmez ve teşkil etmez. Kullanım Koşulları bölümünde daha fazlasını okuyun.