
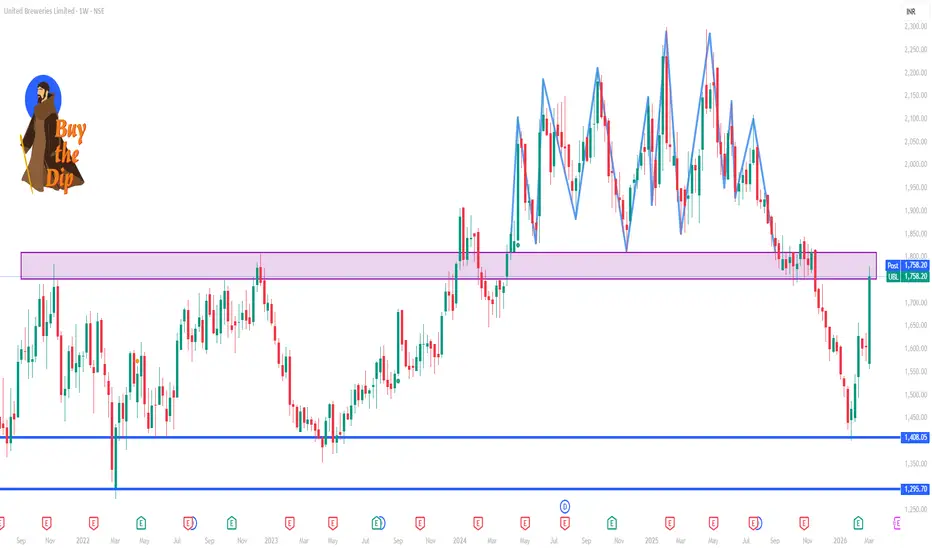
📊 Weekly Levels (Next 1 Week)
Resistance (Upside)
R3: ~₹1,858‑1,860
R2: ~₹1,758‑1,760
R1: ~₹1,693‑1,695
(These are key resistance zones where selling pressure may emerge)
Pivot / Key Reference
Pivot zone: Near mid‑range ~₹1,650‑1,670 (indicative equilibrium)
Support (Downside)
S1: ~₹1,528‑1,530
S2: ~₹1,427‑1,430
S3: ~₹1,360‑1,365
(Below S1 could signal deeper pullbacks)
📌 Weekly Range Projection
Bullish breakout trigger: Weekly close above ~₹1,693‑1,695
Bearish breakdown trigger: Break below ~₹1,528
Expected weekly trading band: ~₹1,360 to ₹1,860 (wide range, high volatility)
🔍 Additional Notes
Weekly pivot calculations vary slightly across tools, but ₹1,690‑1,860 remains the key upside challenge region this week.
On technicals, indicators (e.g., MACD/RSI) show neutral to mixed signals, suggesting no strong trend bias in weekly context.
⚠️ Note: Shares can gap on news and macro events; these levels are technical references, not guaranteed price points.

Contact Knowledgehub for a detailed consultation: Dm on WhatsApp: [wa.link/a2o0kz]-
Phone No: [+91 93102 26243]-
Email: [tradingviewknowledgehub@gmail.com]---
-- Let’s achieve success together!
Phone No: [+91 93102 26243]-
Email: [tradingviewknowledgehub@gmail.com]---
-- Let’s achieve success together!
İlgili yayınlar
Feragatname
Bilgiler ve yayınlar, TradingView tarafından sağlanan veya onaylanan finansal, yatırım, alım satım veya diğer türden tavsiye veya öneriler anlamına gelmez ve teşkil etmez. Kullanım Koşulları bölümünde daha fazlasını okuyun.