
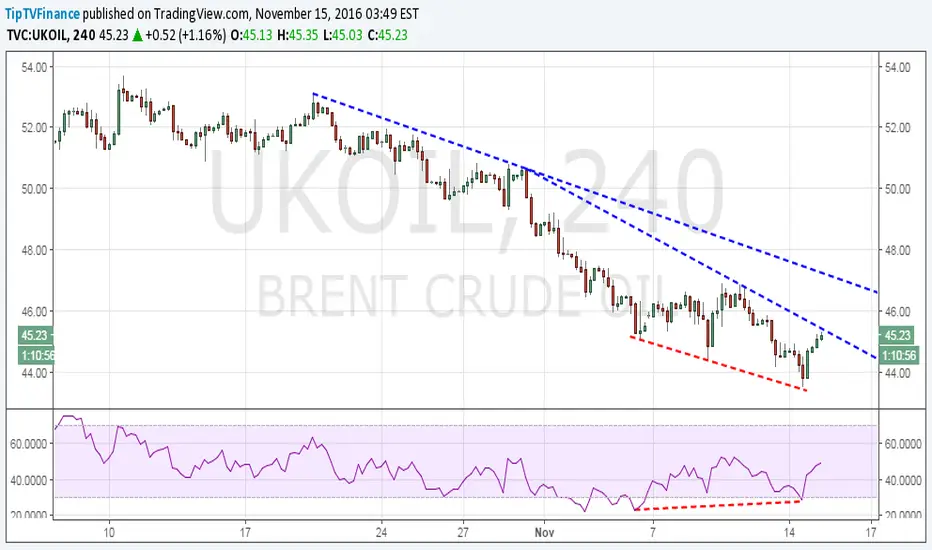
The 4-hour chart shows a bullish price RSI divergence followed by a rise to the descending trend line hurdle.
Oil bulls now await a breach of the trend line hurdle, following which the prices could rise to $46.90 (larger descending trend line hurdle)
On the other hand, a repeated failure to take out trend line hurdle would open doors for a revisit to a recent low of $43.55.
Oil bulls now await a breach of the trend line hurdle, following which the prices could rise to $46.90 (larger descending trend line hurdle)
On the other hand, a repeated failure to take out trend line hurdle would open doors for a revisit to a recent low of $43.55.

Feragatname
Bilgiler ve yayınlar, TradingView tarafından sağlanan veya onaylanan finansal, yatırım, alım satım veya diğer türden tavsiye veya öneriler anlamına gelmez ve teşkil etmez. Kullanım Koşulları bölümünde daha fazlasını okuyun.
Feragatname
Bilgiler ve yayınlar, TradingView tarafından sağlanan veya onaylanan finansal, yatırım, alım satım veya diğer türden tavsiye veya öneriler anlamına gelmez ve teşkil etmez. Kullanım Koşulları bölümünde daha fazlasını okuyun.