
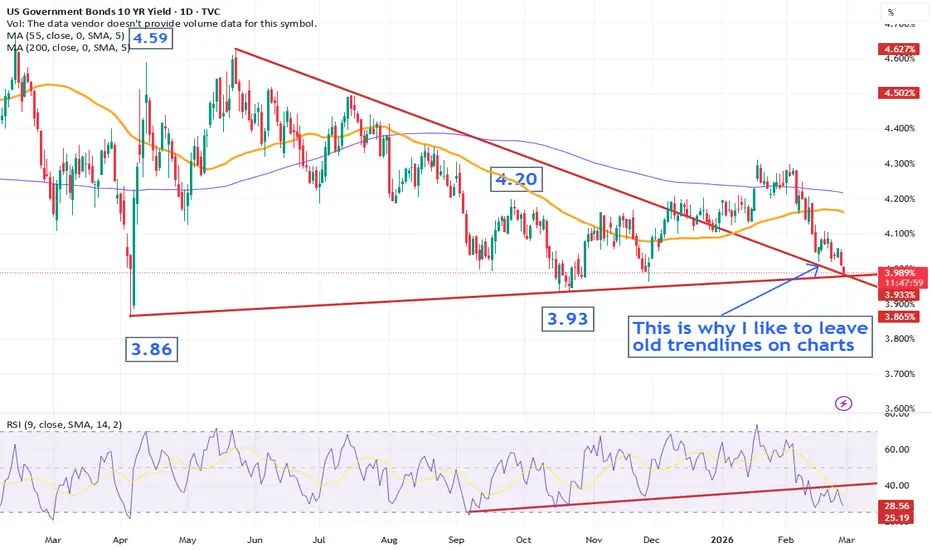
Looking at the US 10‑year yield daily chart, you’ll see I’ve kept a couple of old trend lines on there—because they have a habit of becoming relevant again. And that’s exactly what’s happened. The old downtrend from the May 2025 high is now acting as support, lining up perfectly with the April 2025 support line around 3.98%. With today being Friday, the weekly close matters. The real question is: does 3.98% hold?
(Not investment advice.)
(Not investment advice.)

The STA is the oldest technical analysis organisation in the world and to celebrate that fact, we have a free downloadable book on technical analysis here -
technicalanalysts.com
technicalanalysts.com
Feragatname
Bilgiler ve yayınlar, TradingView tarafından sağlanan veya onaylanan finansal, yatırım, alım satım veya diğer türden tavsiye veya öneriler anlamına gelmez ve teşkil etmez. Kullanım Koşulları bölümünde daha fazlasını okuyun.
The STA is the oldest technical analysis organisation in the world and to celebrate that fact, we have a free downloadable book on technical analysis here -
technicalanalysts.com
technicalanalysts.com
Feragatname
Bilgiler ve yayınlar, TradingView tarafından sağlanan veya onaylanan finansal, yatırım, alım satım veya diğer türden tavsiye veya öneriler anlamına gelmez ve teşkil etmez. Kullanım Koşulları bölümünde daha fazlasını okuyun.